我使用 MatplotLib 和 Cartopy 生成了一些数据图像。
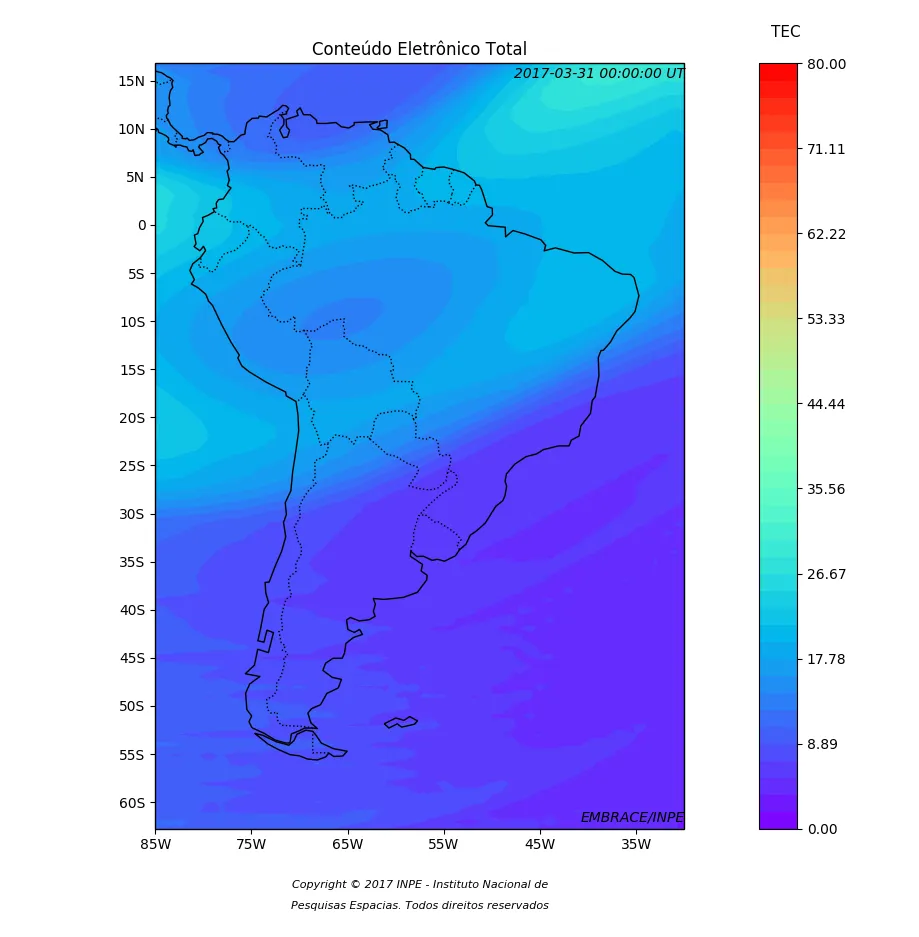
问题在于,当我将框架大小设置为全屏并使用 plt.show() 时,图像完美,并且分辨率很好。
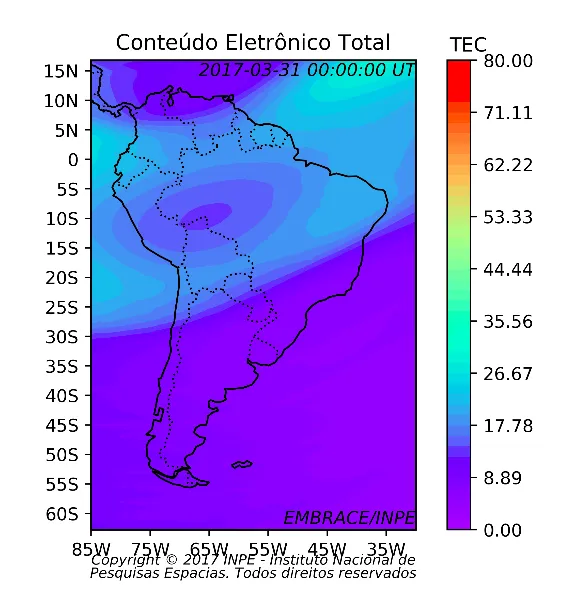
但是,当我使用“plt.savefig()”保存此图时,保存的图像保持其原始大小(不是全屏)。
展示结果图片:
 我的代码如下:
def plot_tec_cartopy(descfile): global matrixLon, matrixLat, matrixTec
提前致谢。
但是,当我使用“plt.savefig()”保存此图时,保存的图像保持其原始大小(不是全屏)。
展示结果图片:

 我的代码如下:
def plot_tec_cartopy(descfile): global matrixLon, matrixLat, matrixTec
ax = plt.axes(projection=cartopy.crs.PlateCarree())

v = np.linspace(0, 80, 46, endpoint=True)
cp = plt.contourf(matrixLon, matrixLat, matrixTec, v, cmap=plt.cm.rainbow)
plt.clim(0, 80)
plt.colorbar(cp)

ax.add_feature(cartopy.feature.COASTLINE)
ax.add_feature(cartopy.feature.BORDERS, linestyle=':')
ax.set_extent([-85, -30, -60, 15])

# Setting X and Y labels using LON/LAT format
ax.set_xticks([-85, -75, -65, -55, -45, -35])
ax.set_yticks([-60, -55, -50, -45, -40, -35, -30, -25, -20, -15, -10, -5, 0, 5, 10, 15])
lon_formatter = LongitudeFormatter(number_format='.0f',
                                   degree_symbol='',
                                   dateline_direction_label=True)
lat_formatter = LatitudeFormatter(number_format='.0f',
                                  degree_symbol='')
ax.xaxis.set_major_formatter(lon_formatter)
ax.yaxis.set_major_formatter(lat_formatter)

plt.title('Conteúdo Eletrônico Total', style='normal', fontsize='12')

# Acquiring Date
year, julianday = check_for_zero(descfile.split('.')[2]), descfile.split('.')[3]
hour, minute = descfile.split('.')[4], descfile.split('.')[5].replace('h','')
date = datetime.datetime(int(year), 1, 1, int(hour), int(minute)) + datetime.timedelta(int(julianday)-1)
month = date.month
day = date.day

# Set common labels
ax.text(1.22, 1.05, 'TEC', style='normal',
    verticalalignment='top', horizontalalignment='right',
    transform=ax.transAxes,
    color='black', fontsize=11)
ax.text(1, 0.005, 'EMBRACE/INPE', style='italic',
    verticalalignment='bottom', horizontalalignment='right',
    transform=ax.transAxes,
    color='black', fontsize=10)
ax.text(1, 0.995, str(date) + ' UT', style='italic',
    verticalalignment='top', horizontalalignment='right',
    transform=ax.transAxes,
    color='black', fontsize=10)
ax.text(0.5, -0.08, 'Copyright \N{COPYRIGHT SIGN} 2017 INPE - Instituto Nacional de',
    style='oblique', transform=ax.transAxes,
    verticalalignment='bottom', horizontalalignment='center',
    color='black', fontsize=8)
ax.text(0.5, -0.108, 'Pesquisas Espacias. Todos direitos reservados',
    style='oblique', transform=ax.transAxes,
    verticalalignment='bottom', horizontalalignment='center',
    color='black', fontsize=8)

manager = plt.get_current_fig_manager()
manager.resize(*manager.window.maxsize())

figName = 'tec.map' + '.' + str(year) + '.' + str(julianday) + '.' + str(hour) + '.' + str(minute) + 'h.png'
#plt.show()
plt.savefig(figName, dpi=500)
plt.clf()
提前致谢。