Matplotlib的savefig函数无法保存坐标轴。

32
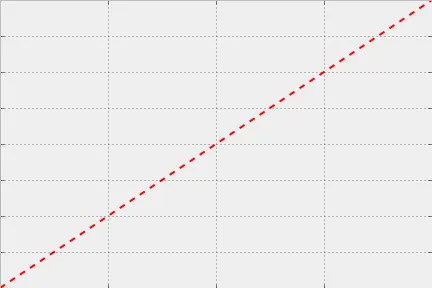
我正在尝试保存一个在IPython inline中正常工作的图形,但无法将带有坐标轴和标题的图形保存到磁盘上。
我在matplotlibrc中默认使用TKAgg后端。
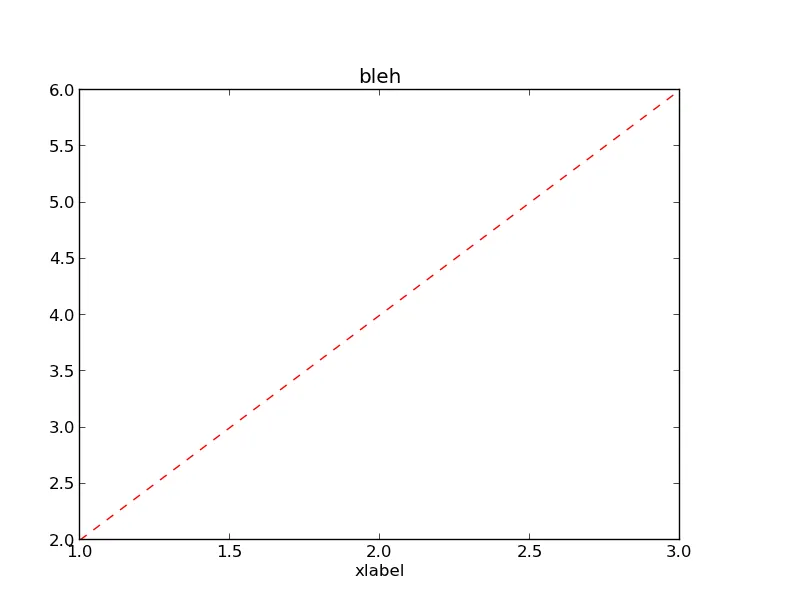
这里可能出了什么问题?我已经明确设置了xlabel,并且在IPython inline绘图中刻度标记也正常工作。
import matplotlib.pylab as plt  
x = [1,2,3,3]
y = map(lambda(x): x * 2, x)
fig = plt.figure()
ax = fig.add_axes([0,0,1,1])
ax.set_title("bleh")
ax.set_xlabel("xlabel")
ax.plot(x, y, 'r--')
fig.savefig("fig.png")

Savefig image without axes labels

6个回答

26

在开始时定义fig = plt.figure(figsize=(15,10)),将文件保存为.jpg格式并设置 bbox_inches='tight'plt.savefig('filename.jpg',bbox_inches='tight', dpi=150)解决了我的问题。bbox_inches='tight'似乎可以修复裁剪问题,但它对.png格式无效。


2
从实际角度来看,这个答案是最好的。我只将文件格式从png改为jpg,生成的图像包含了我期望的轴线。今天已经足够好了。但对我来说仍然很沮丧的是不理解为什么它们不同以及如何输出预期的.png文件。 - mdahlman
莫莉在下面的回答中解释了为什么 ;) - Pedro Torres
适用于.tiff,但添加bbox_inches参数。 - statHacker

13

可能是面颜色。我在Jupyter Lab中工作,面颜色默认设置为黑色,所以即使它们被绘制出来,你也看不到坐标轴。

fig = plt.figure(facecolor=(1, 1, 1))

设置背景颜色为白色。


这是针对在Jupyter笔记本中遇到问题的人的正确解决方案。非常感谢! - iamakhilverma

8

您正在将轴设置为从图形的左下角开始,并填充整个图形。没有空间放置轴标签或标题。请尝试以下内容:

import matplotlib.pylab as plt  
x = [1,2,3,3]
y = map(lambda(x): x * 2, x)
fig = plt.figure()
ax = fig.add_axes([0.1,0.1,0.75,0.75]) # axis starts at 0.1, 0.1
ax.set_title("bleh")
ax.set_xlabel("xlabel")
ax.plot(x, y, 'r--')
fig.savefig("fig.png")

plot with axis showing


3
或者只需使用 ax = fig.add_subplot(1, 1, 1),或者更好的方法是 fig, ax = plt.subplots()。+1 - Joe Kington
2
或者 fig, ax = plt.subplots(1, 1, tight_layout=True)(假设您的 mpl 版本足够新) - tacaswell
1
plt.figure(tight_layout=True) => plt.figure(tight_layout=True) - Quetzalcoatl
1
尝试创建 png 文件时没有起作用,改为使用 jpg 就解决了。 - zooblin

5

我在使用Jupyter笔记本和命令:%matplotlib notebook时遇到了同样的问题。图像在笔记本中正确显示,但保存为fig.savefig()时没有打印轴和标题。我将%matplotlib notebook更改为%matplotlib inline,问题得到解决。


4

通过将格式从“png”更改为“jpg”,以及使用参数“plt.subplots(tight_layout=True)”来解决了在 Visual Studio Code Jupyter 扩展中遇到的问题。


3

我正在使用Jupyter Notebook,只需要将.png更改为.jpg,我的问题现在已经解决了。这是我的代码:

# changing the size of figure to 2X2
plt.figure(dpi=100, figsize=(15, 10))
plt.grid()
#display(plt.plot(year1, ratio1))
x = np.arange(1900, 2020, 5)
plt.xticks(x)
plt.title(ttile)
plt.xlabel('Year')
plt.ylabel('Ratio')
plt.plot(year,ratio)
plt.savefig('books_read.jpg', dpi = 300)

从代码中保存的图片


2
很有帮助!将 .png 改为 .jpg 后,在 Jupyter 之外也起作用了! - Debvrat Varshney

网页内容由stack overflow 提供, 点击上面的
可以查看英文原文,
原文链接