Matplotlib,savefig:忽略DPI设置

10

我找不到其他人有这个问题。在Matplotlib中,您可以使用show()或savefig()查看绘图。它们生成略微不同的图像;在我的情况下,savefig()生成的图像更加丑陋和难以理解。我需要让我的考官生活变得轻松,所以...

我发现一些主题建议我将DPI大小设置为与show()相匹配。我尝试过:

-> 直接使用matplotlib.rcParams['savefig.dpi'] = 80设置savefig.dpi。

-> 在~/.matplotlib/matplotlibrc中直接设置savefig.dpi。

-> 将我的rc文件移动到CWD。

-> 最后,使用savefig('image.pdf', dpi=80)

我可以验证属性确实已被设置;但似乎savefig()忽略了设置。有人可以帮忙吗?

(简化)代码:

plt.bar(ind, functimes, yerr=stddev, bottom=0, width=barWidth, align='center', color='b')

ax = plt.gca()
ax.legend(barRcts, barLegend)
plt.title("Function Call Overhead")
plt.xlabel("Function ID")
plt.ylabel("Execution Time [us]")

plt.xticks(ind, funcNames)
figtest.autofmt_xdate()

plt.savefig(out_file, dpi=80, format='pdf')
8
matplotlib 以矢量格式保存 pdf 文件。除非您在其中有位图图像,否则在矢量图像中 DPI 相当无意义,因为它们是与分辨率无关的。 - Avaris
1
啊哈,我明白了。所以没有办法使用savefig()保存PDF图像,使它们与您可以手动保存的show()完全相同? - memstick
5
它们应该是完全相同的,唯一可能的区别是如果在保存前调整了图像的大小。但是你也可以设定图像的尺寸 (figure((width, height))) ,然后 savefig 将使用该尺寸。 - Avaris
好的,搞定了。非常感谢,你帮我节省了很多宝贵的时间 :) - memstick
2个回答

5

PDF保存使用PDF内图像分辨率的DPI设置,而不是任何线条/多边形分辨率(这在矢量格式中没有意义)。

如果您对屏幕输出满意,并且不需要可缩放的图形,则保存为png可能就足够了。


但请注意,如果您使用了contourf(例如),则在您的pdf/svg内部会得到一个光栅图像,因此dpi再次具有意义。 - Chris H
@ChrisH - 我不同意。Contourf 生成矢量输出而不是光栅图像。然而,imshow 会生成图像,因此(从记忆中)存在一个图像 dpi 来协助。希望有所帮助。 - pelson
1
结果证明你是对的 - 根据我的5.5 MB .svg,它会使Inkscape变得非常缓慢。然后dpi设置有助于正确设置轴和重叠线的线宽。我之前已经意识到这一点,但忘记登录并更新了。 - Chris H

1
在你的IDE上,当你将光标移动到函数plt.savefig()上时,它会显示如下内容:(function) savefig: (*args: Any, **kwargs: Any) 这意味着该函数只接受无限制的参数(*args)和关键字参数(**kwargs)。因此,如果您查看Matplotlib的文档,您将找到您可以使用的参数https://matplotlib.org/3.1.1/api/_as_gen/matplotlib.pyplot.savefig.html
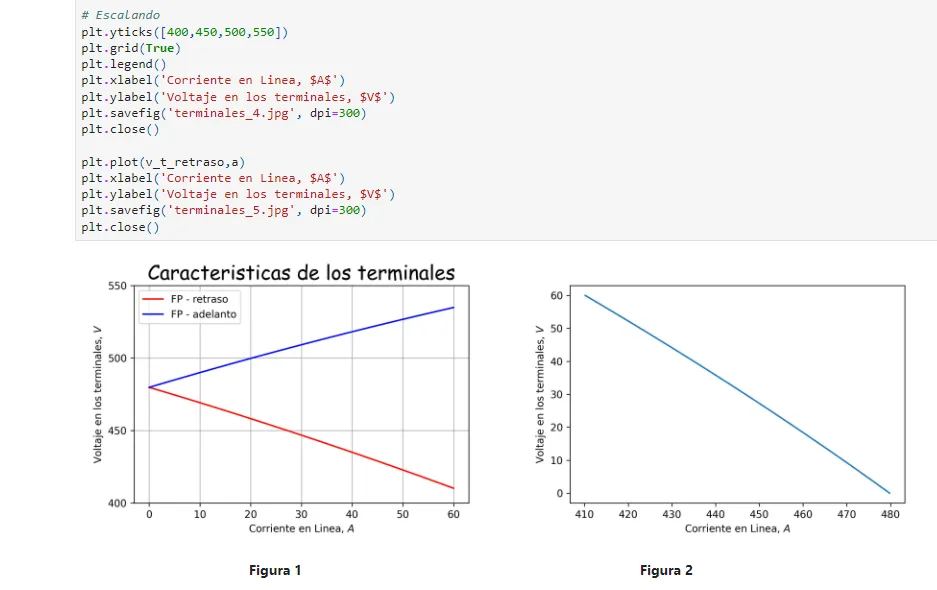
现在,如果你只想展示高质量的图形,你可以按照以下步骤进行操作。在vscode上打开一个jupyter笔记本,并编写plt.savefig("my_image.jpg", dpi = 300) [dpi代表每英寸点数,如果您使用更高的dpi,您将获得更高质量的图像] 然后使用markdown代码展示您的图形:
plt.plot(a,v_t_retraso, 'r', label = 'FP - retraso')
plt.plot(a,v_t_adelanto,'b', label = 'FP - adelanto')

plt.title('Caracteristicas de los terminales', fontdict={'fontname': 'Comic Sans MS', 'fontsize': 20})

# Escalando
plt.yticks([400,450,500,550])
plt.grid(True)
plt.legend()
plt.xlabel('Corriente en Linea, $A$')
plt.ylabel('Voltaje en los terminales, $V$')
plt.savefig('terminales_4.jpg', dpi=300)
plt.close()

plt.plot(v_t_retraso,a)
plt.xlabel('Corriente en Linea, $A$')
plt.ylabel('Voltaje en los terminales, $V$')
plt.savefig('terminales_5.jpg', dpi=300)
plt.close()

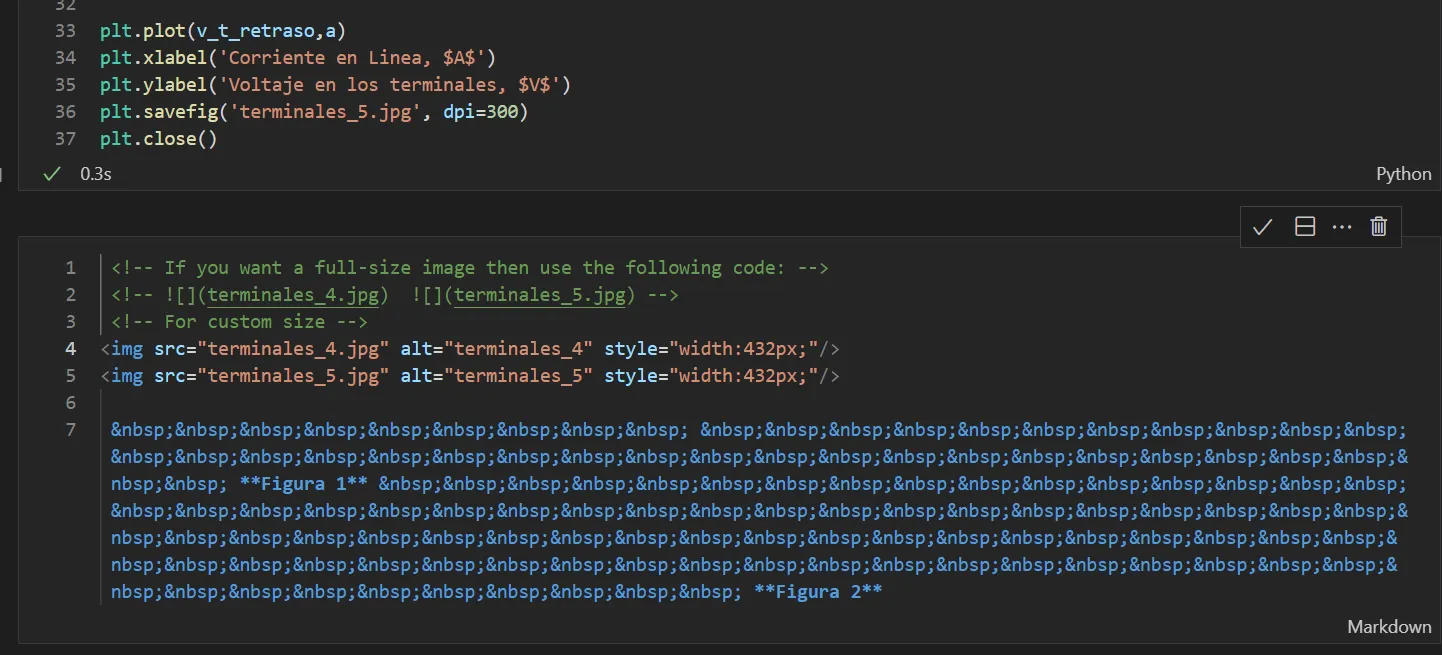
使用保存的图片,您可以在Markdown上打开一个单元格并编写以下代码:
 <!-- If you want a full-size image then use the following code: -->
 <!-- ![](terminales_4.jpg)  ![](terminales_5.jpg) -->
 <!-- For custom size -->
<img src="terminales_4.jpg" alt="terminales_4" style="width:432px;"/>
<img src="terminales_5.jpg" alt="terminales_5" style="width:432px;"/>


Code Example on Jupyter Notebook

最后,您可以将代码导出为HTML或PDF,并展示任意数量的图形。下图显示了一个例子。

Result of the example


网页内容由stack overflow 提供, 点击上面的
可以查看英文原文,
原文链接