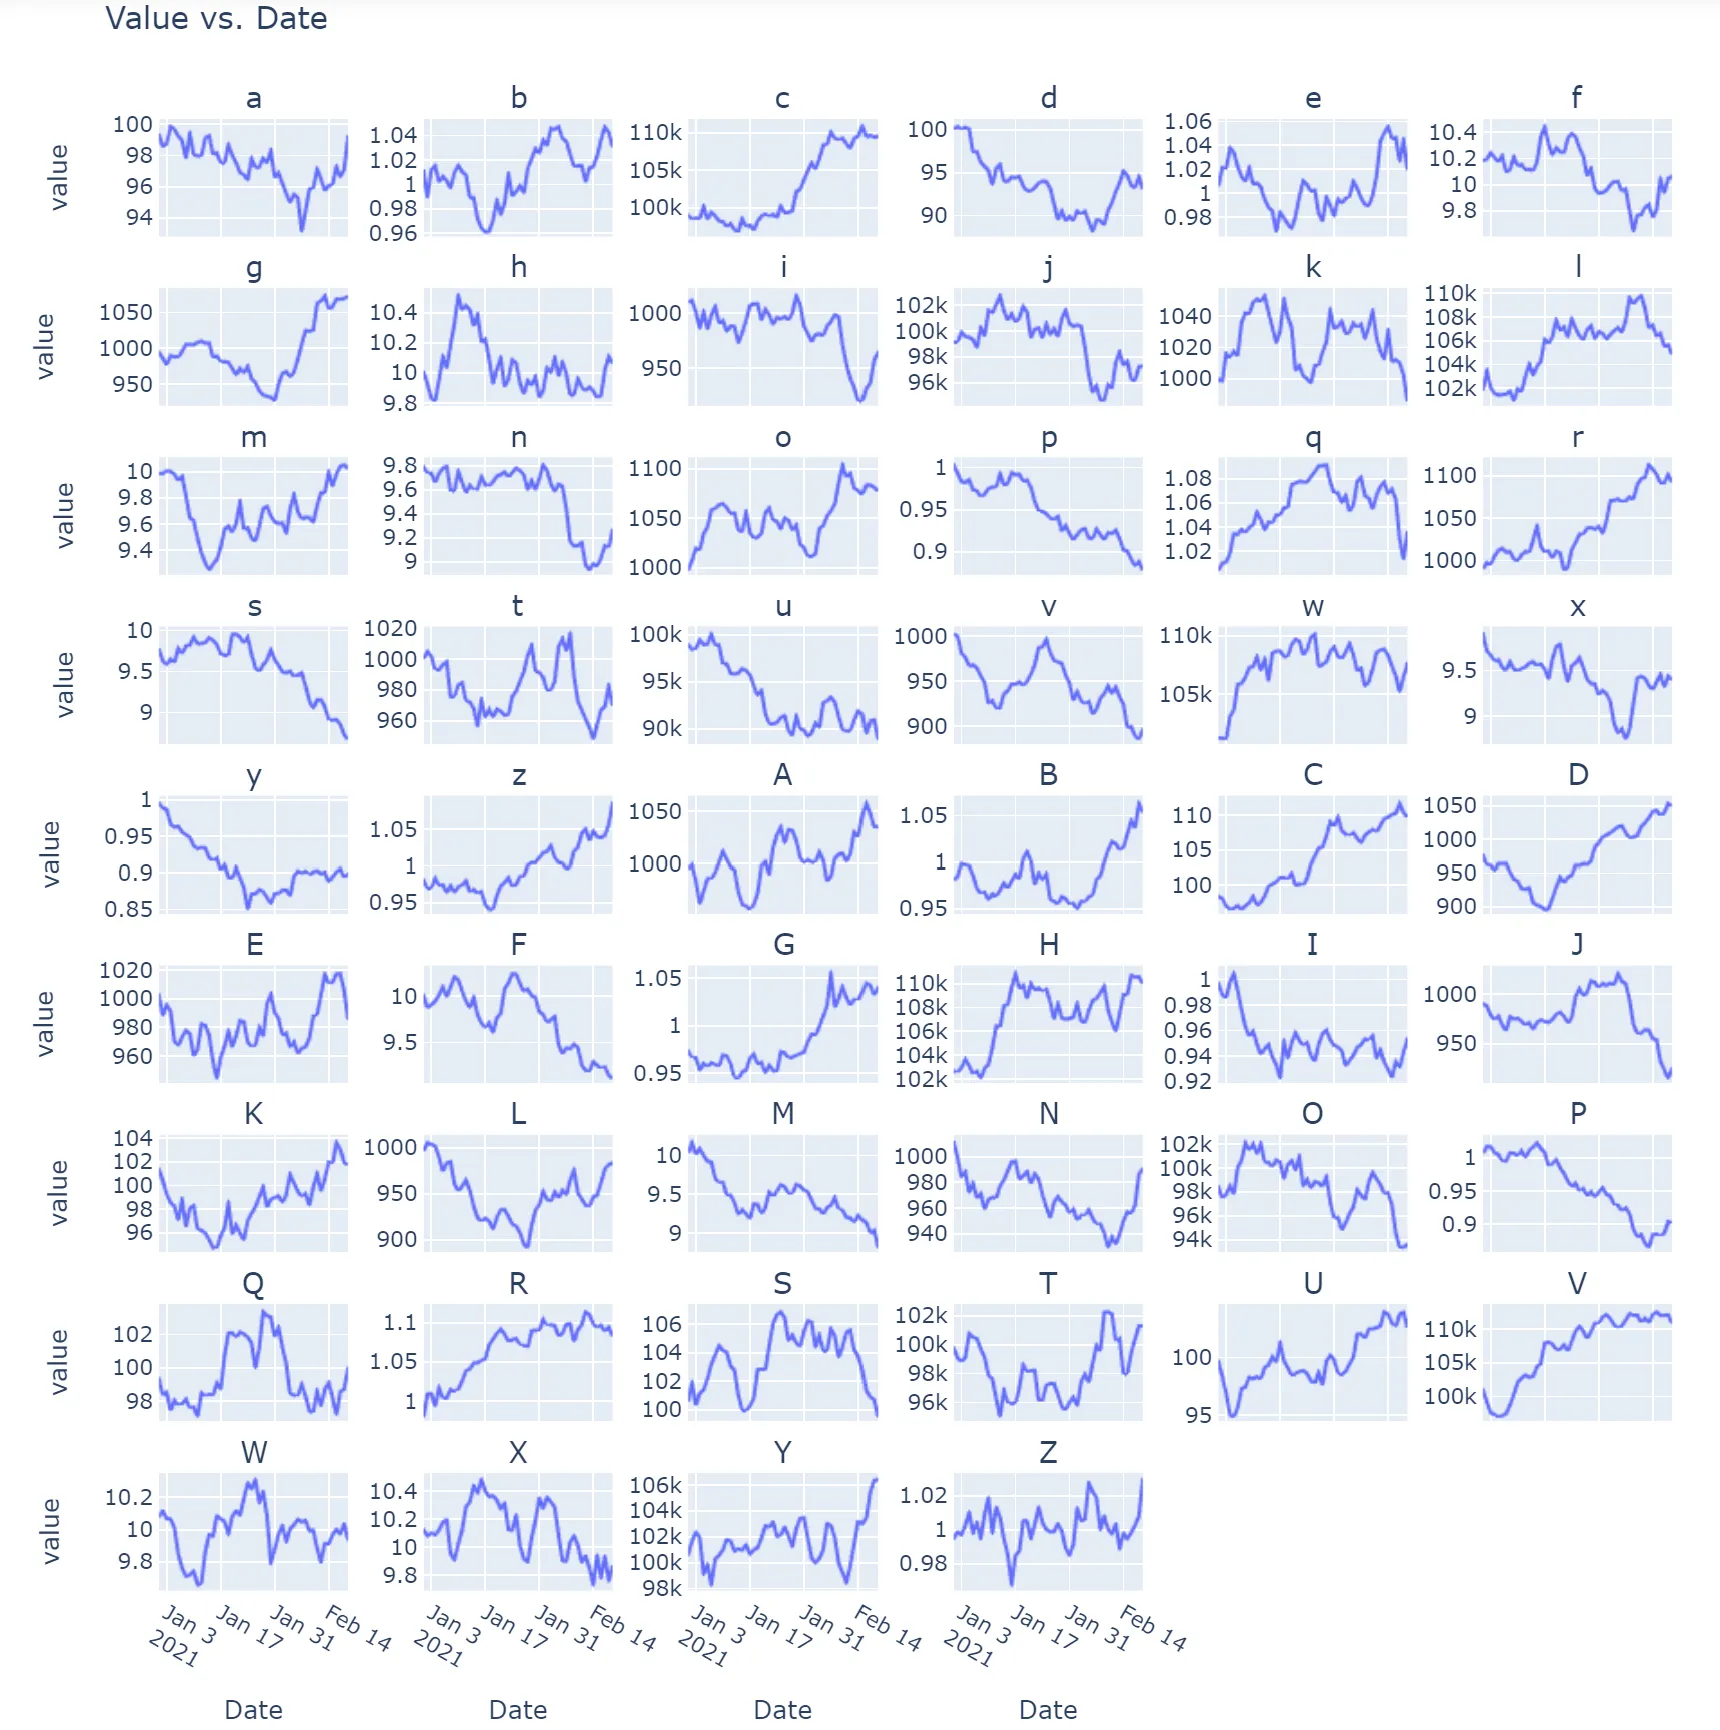
使用Plotly Express在多面板图表中隐藏重复的坐标轴标题是否有简单的方法?我尝试过设置。
以下是测试代码:
visible=True
以下是测试代码:
import pandas as pd
import numpy as np
import plotly.express as px
import string
# create a dataframe
cols = list(string.ascii_letters)
n = 50
df = pd.DataFrame({'Date': pd.date_range('2021-01-01', periods=n)})
# create data with vastly different ranges
for col in cols:
start = np.random.choice([1, 10, 100, 1000, 100000])
s = np.random.normal(loc=0, scale=0.01*start, size=n)
df[col] = start + s.cumsum()
# melt data columns from wide to long
dfm = df.melt("Date")
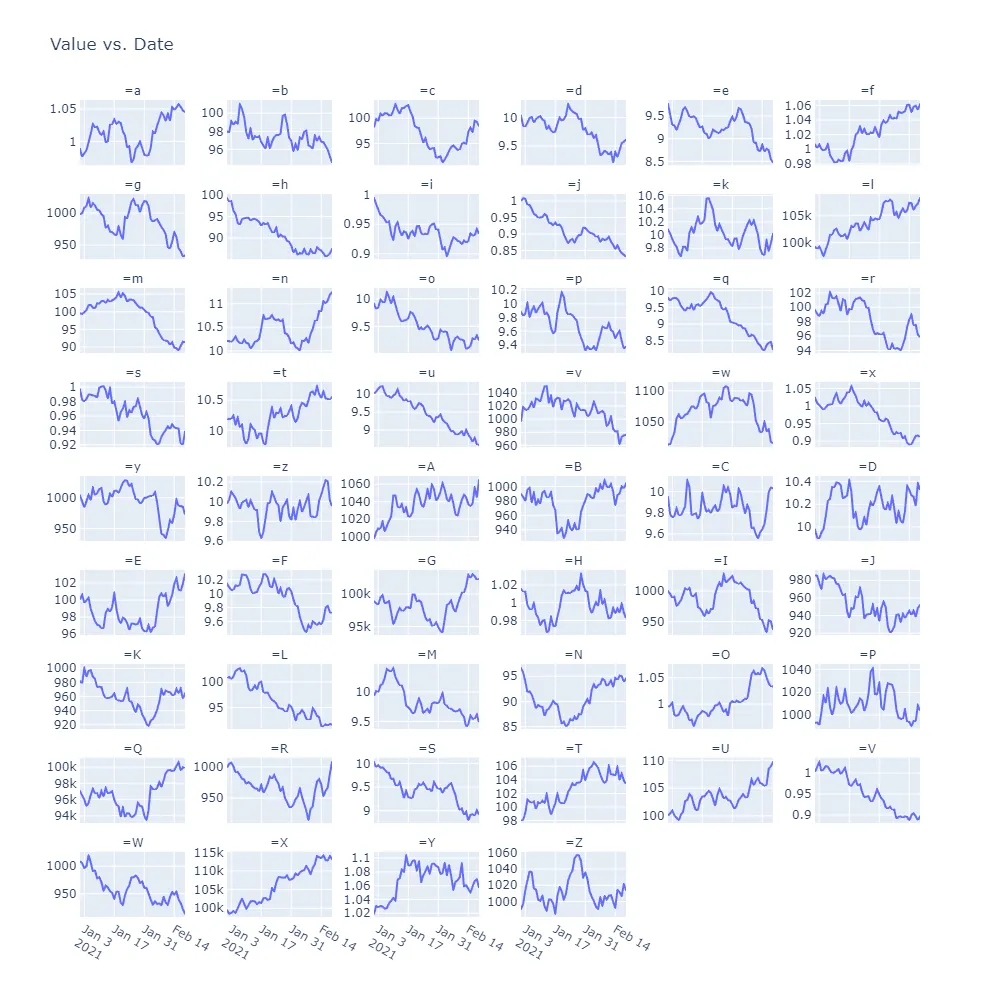
fig = px.line(
data_frame=dfm,
x = 'Date',
y = 'value',
facet_col = 'variable',
facet_col_wrap=6,
facet_col_spacing=0.05,
facet_row_spacing=0.035,
height = 1000,
width = 1000,
title = 'Value vs. Date'
)
fig.update_yaxes(matches=None, showticklabels=True, visible=True)
fig.update_annotations(font=dict(size=16))
fig.for_each_annotation(lambda a: a.update(text=a.text.split("=")[-1]))
最终代码(被接受的答案)。注意 plotly >= 4.9
import pandas as pd
import numpy as np
import plotly.express as px
import string
import plotly.graph_objects as go
# create a dataframe
cols = list(string.ascii_letters)
n = 50
df = pd.DataFrame({'Date': pd.date_range('2021-01-01', periods=n)})
# create data with vastly different ranges
for col in cols:
start = np.random.choice([1, 10, 100, 1000, 100000])
s = np.random.normal(loc=0, scale=0.01*start, size=n)
df[col] = start + s.cumsum()
# melt data columns from wide to long
dfm = df.melt("Date")
fig = px.line(
data_frame=dfm,
x = 'Date',
y = 'value',
facet_col = 'variable',
facet_col_wrap=6,
facet_col_spacing=0.05,
facet_row_spacing=0.035,
height = 1000,
width = 1000,
title = 'Value vs. Date'
)
fig.update_yaxes(matches=None, showticklabels=True, visible=True)
fig.update_annotations(font=dict(size=16))
fig.for_each_annotation(lambda a: a.update(text=a.text.split("=")[-1]))
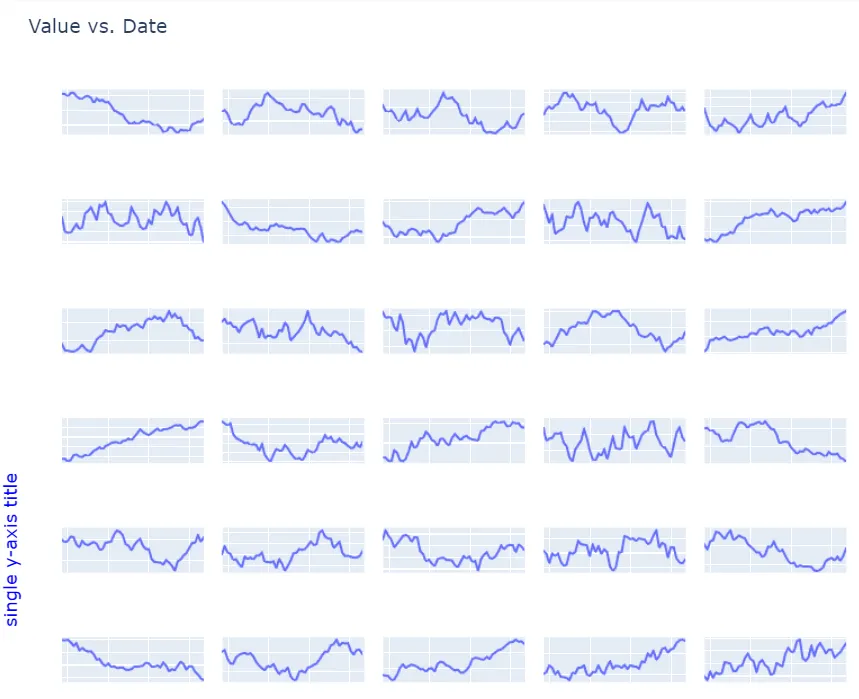
# hide subplot y-axis titles and x-axis titles
for axis in fig.layout:
if type(fig.layout[axis]) == go.layout.YAxis:
fig.layout[axis].title.text = ''
if type(fig.layout[axis]) == go.layout.XAxis:
fig.layout[axis].title.text = ''
# keep all other annotations and add single y-axis and x-axis title:
fig.update_layout(
# keep the original annotations and add a list of new annotations:
annotations = list(fig.layout.annotations) +
[go.layout.Annotation(
x=-0.07,
y=0.5,
font=dict(
size=16, color = 'blue'
),
showarrow=False,
text="single y-axis title",
textangle=-90,
xref="paper",
yref="paper"
)
] +
[go.layout.Annotation(
x=0.5,
y=-0.08,
font=dict(
size=16, color = 'blue'
),
showarrow=False,
text="Dates",
textangle=-0,
xref="paper",
yref="paper"
)
]
)
fig.show()