我会使用matplotlib来绘制数据框中的条形图。我使用以下结构首先绘制整个数据集:
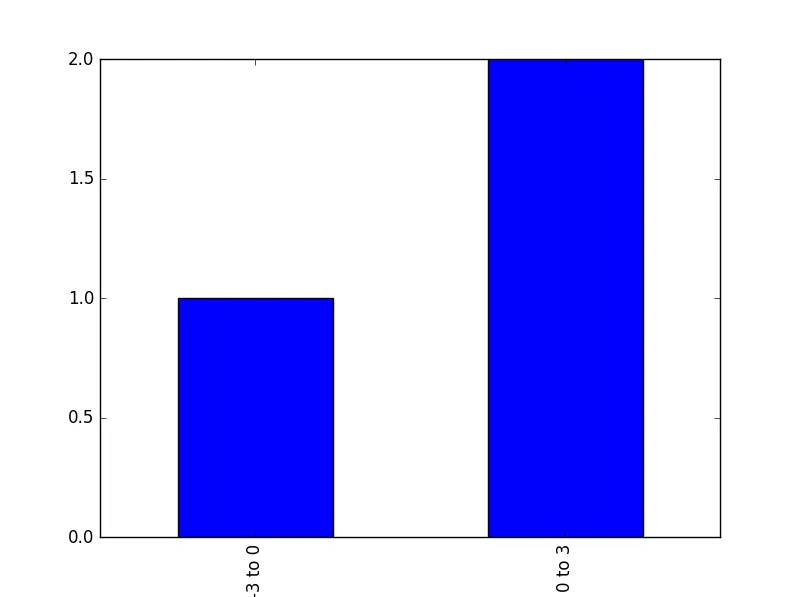
当我运行这段代码时,奇怪的是它只适用于“南部”地区。对于“南部”,图表会生成,但对于我尝试的任何其他地区,代码都会运行(我没有收到错误消息),但是图表从未显示出来。在除南部以外的任何地区运行我的代码都会在控制台中产生这种结果。
import pandas as pd
from collections import Counter
import matplotlib.pyplot as plt

Temp_Counts = Counter(weatherDFConcat['TEMPBIN_CONS'])
df = pd.DataFrame.from_dict(Temp_Counts, orient = 'index').sort_index()
df.plot(kind = 'bar', title = '1969-2015 National Temp Bins', legend = False, color = ['r', 'r', 'g', 'g', 'b', 'b', 'r', 'r', 'g', 'g', 'b', 'b', 'r', 'r', 'g', 'g', 'b', 'b', 'r', 'r', 'g', 'g', 'b', 'b','r', 'r', 'g', 'g', 'b', 'b', 'r', 'r', 'g', 'g' ] )
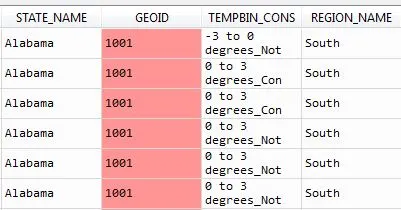
现在我想绘制数据的同一列,但我想在特定的数据子集上这样做。对于'region_name'中的每个区域,我想生成条形图。这是我的DataFrame的一个示例。
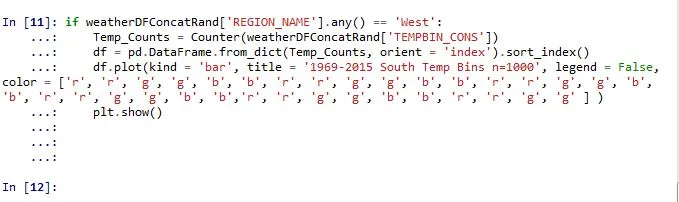
我的尝试解决方案是写:
if weatherDFConcat['REGION_NAME'].any() == 'South':
    Temp_Counts = Counter(weatherDFConcat['TEMPBIN_CONS'])
    df = pd.DataFrame.from_dict(Temp_Counts, orient = 'index').sort_index()
    df.plot(kind = 'bar', title = '1969-2015 National Temp Bins', legend = False, color = ['r', 'r', 'g', 'g', 'b', 'b', 'r', 'r', 'g', 'g', 'b', 'b', 'r', 'r', 'g', 'g', 'b', 'b', 'r', 'r', 'g', 'g', 'b', 'b','r', 'r', 'g', 'g', 'b', 'b', 'r', 'r', 'g', 'g' ] )
    plt.show()
当我运行这段代码时,奇怪的是它只适用于“南部”地区。对于“南部”,图表会生成,但对于我尝试的任何其他地区,代码都会运行(我没有收到错误消息),但是图表从未显示出来。在除南部以外的任何地区运行我的代码都会在控制台中产生这种结果。
南部地区是我的DataFrame中的第一部分,该DataFrame有4000万行,其他地区在下面。我尝试绘制的DataFrame的大小是否会影响这个问题?