我有一个p-value矩阵(
我使用的代码如下:
pvalmat),想要绘制一个瓷砖图以描述不同范围的p值。之前在stackoverflow上,人们注意到drop=FALSE参数足以保留瓷砖图中的所有类别。但这对我不起作用。我使用的代码如下:
library(reshape)
library(ggplot2)
t1 <- "
PC1 PC2 PC3 PC4 PC5
Sample_Group 0.8736898 0.97622168 0.2561840 0.42037376 0.1014430
Patient_ID 0.5715401 0.11196997 0.7373194 0.29259420 0.4492927
Batch 0.2372638 0.31829279 0.6886578 0.13898381 0.8962650
Gender 0.2849828 0.19308078 0.7906396 0.70711634 0.1862483
Race 0.9625020 0.86909694 0.9539444 0.45216929 0.4484681
Vital_Status 0.6132153 0.59893269 0.1587745 0.77892172 0.7018237
Family_History 0.5434387 0.19100356 1.0000000 0.20342504 0.8735441
Tissue_Source_Site 0.5448434 0.06034538 0.2239321 0.03223223 0.9604476
Initial_Weight 0.3545216 0.42727010 0.3310045 0.72190824 0.5736651
Age 0.5180032 0.28494126 0.4975151 0.37259105 0.4632363
"
con <- textConnection(t1)
pvalmat <- read.table(con, row.names = NULL)
pvalmat.m <- melt(pvalmat)
colnames(pvalmat.m) <- c("Clinical_Variables", "Principal_Component", "pval")
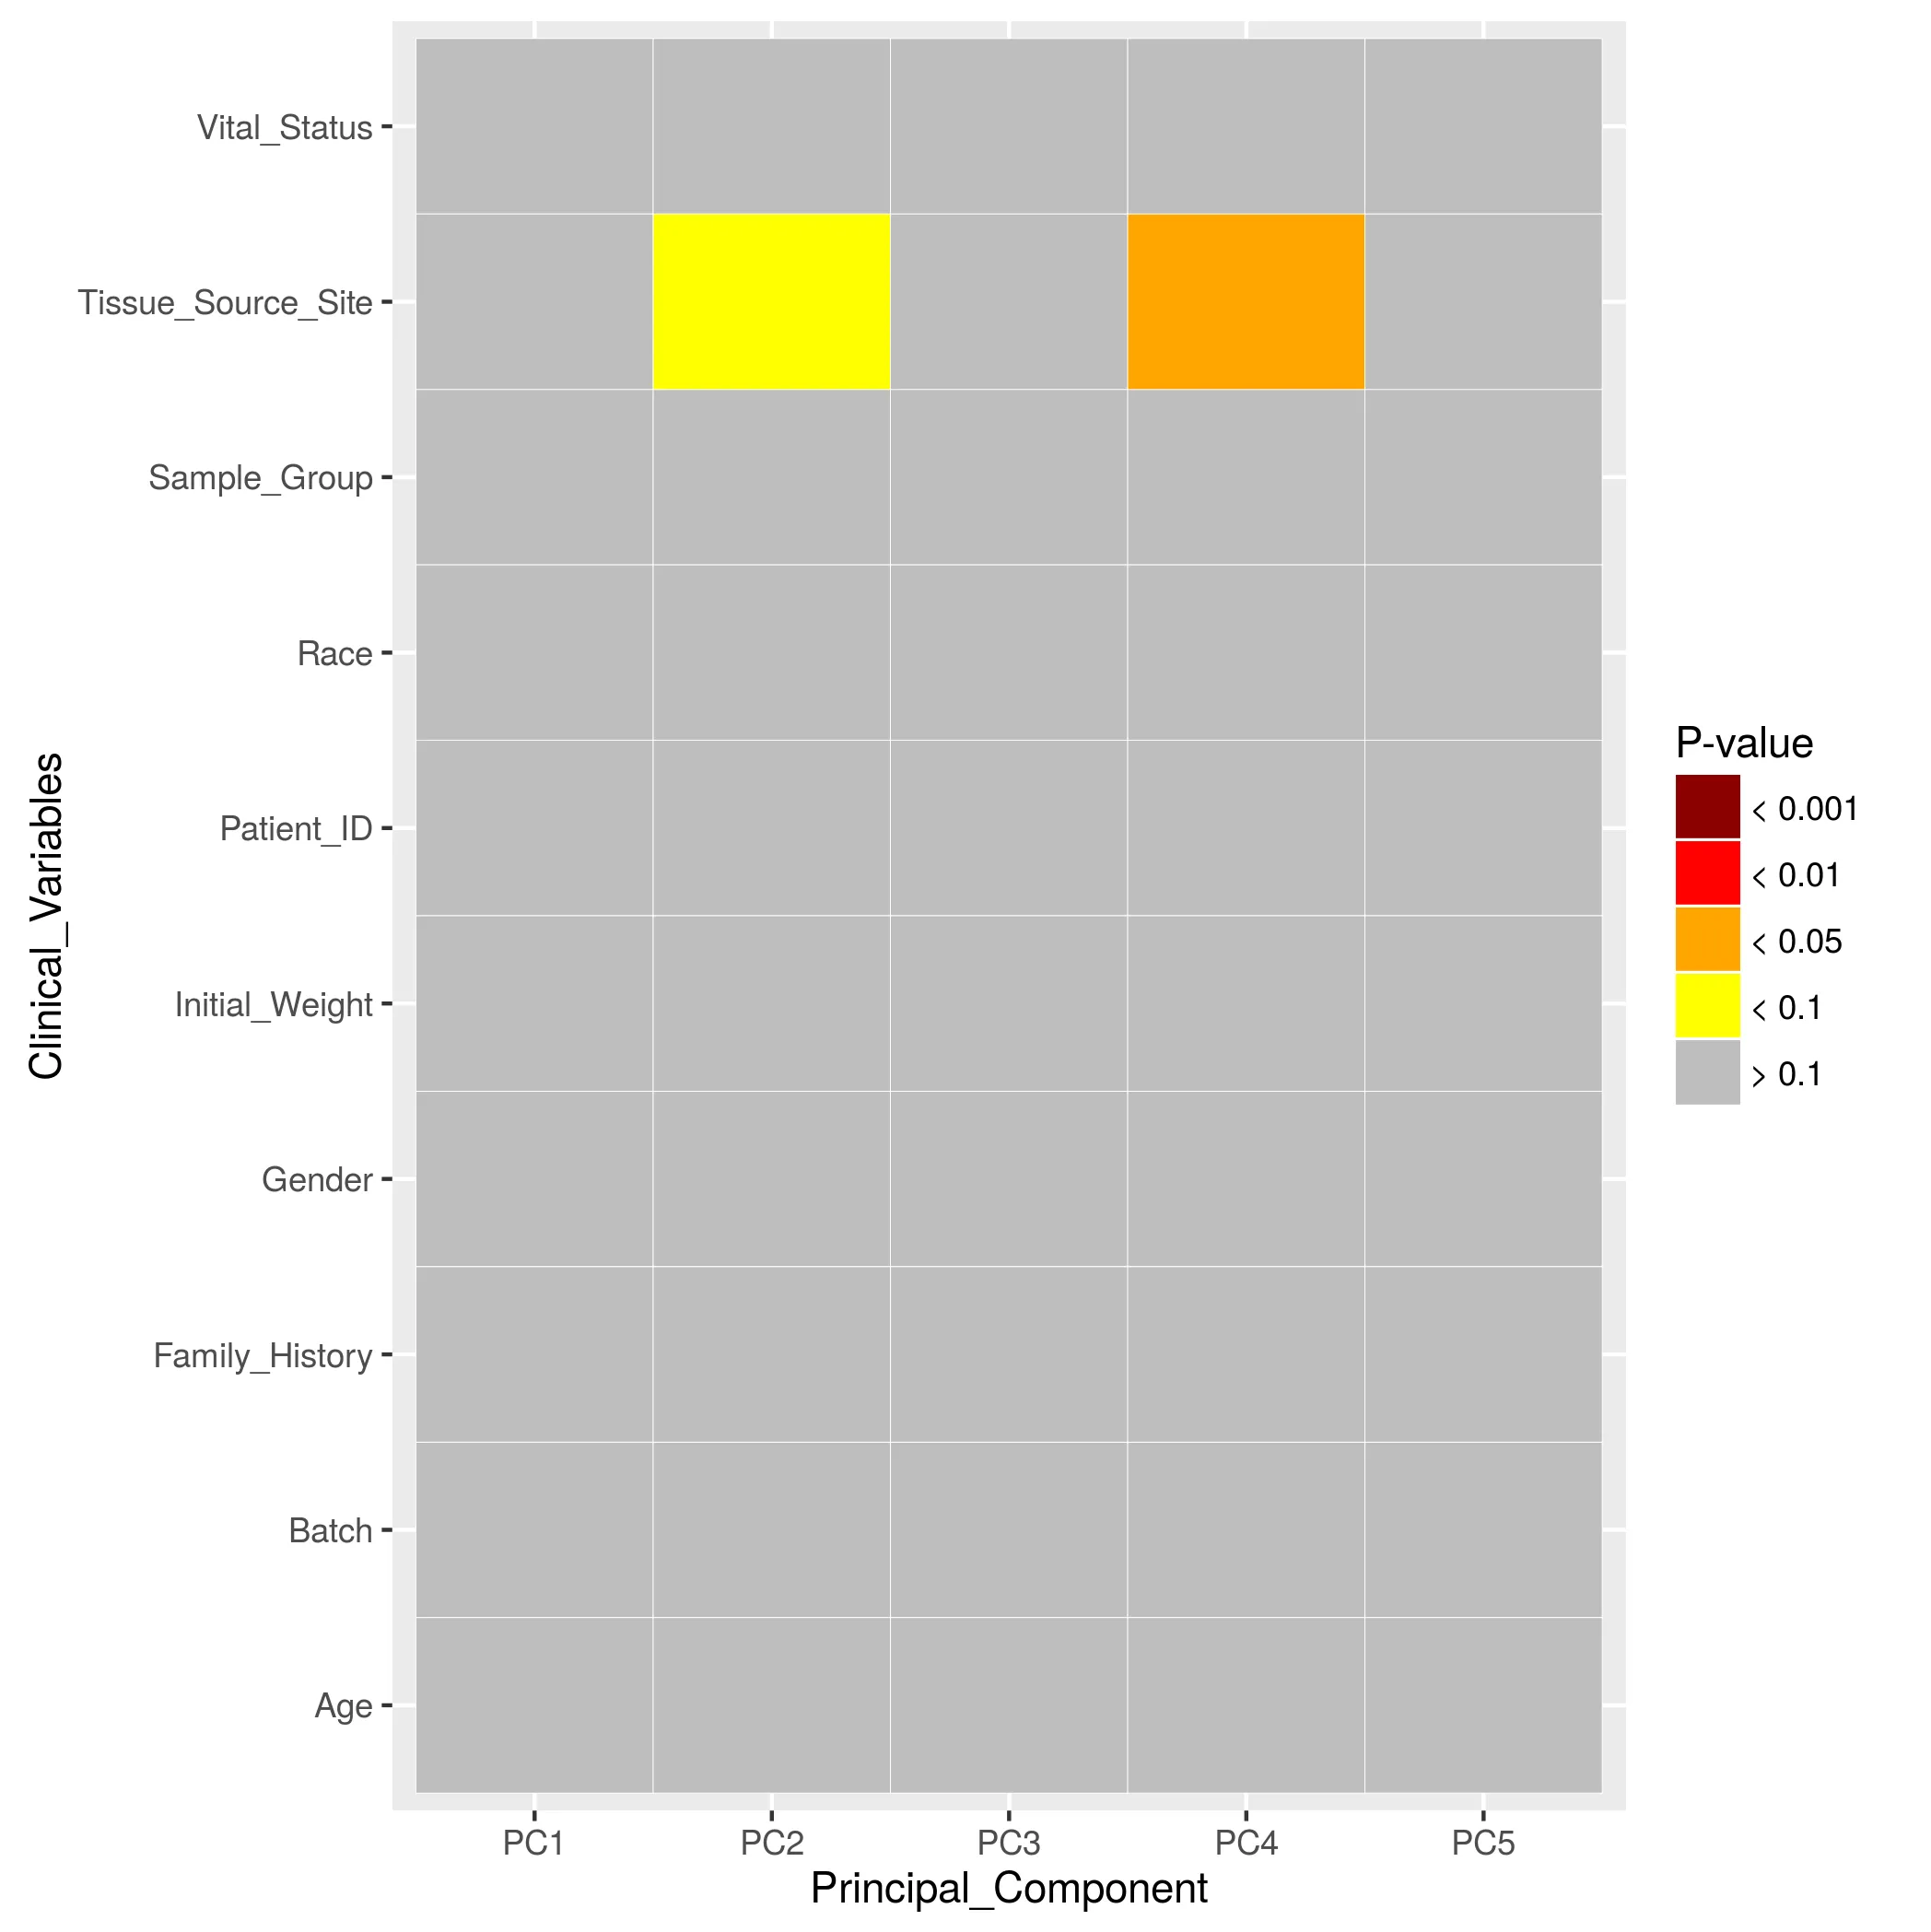
pvalmat.m$colorcut <- cut(pvalmat.m$pval,breaks = c(-Inf,0.001, 0.01, 0.05, 0.1, Inf), right = FALSE)
p <- ggplot(pvalmat.m, aes(Principal_Component, Clinical_Variables)) + geom_tile(aes(fill = colorcut), colour = "white") +
scale_fill_manual(breaks=c("[-Inf, 0.001)", "[0.001, 0.01)", "[0.01, 0.05)",
"[0.05, 0.1)", "[0.1, Inf)"),
values = c("darkred", "red", "orange", "yellow", "gray"),
name="P-value", labels=c("< 0.001", "< 0.01", "< 0.05", "< 0.1", "> 0.1"),
drop=FALSE) +
labs(x="Principal Components", y="Clinical Variables")
然而我只在图例中收到了一个类别:
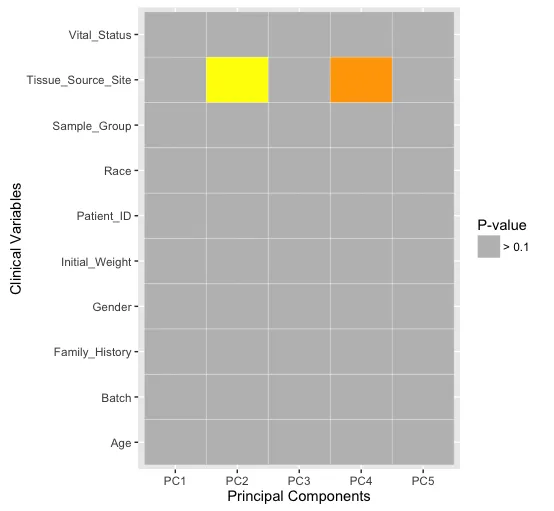
尽管它正确地显示颜色,但为什么它不显示所有类别的图例?
谢谢!