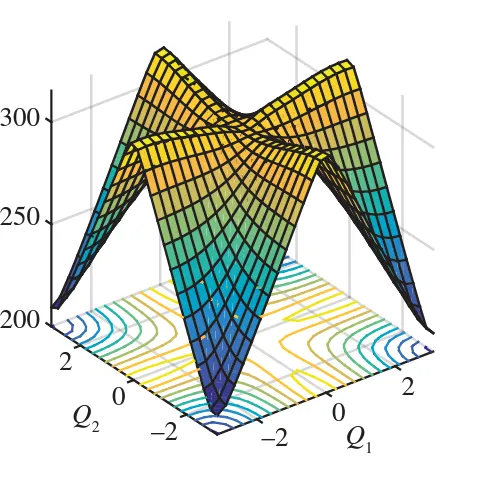
在Python中是否可以绘制像这样的2D和3D等高线图。
抱歉,我无法用数学方程式等详细说明情节。
在Python中是否可以绘制像这样的2D和3D等高线图。
抱歉,我无法用数学方程式等详细说明情节。
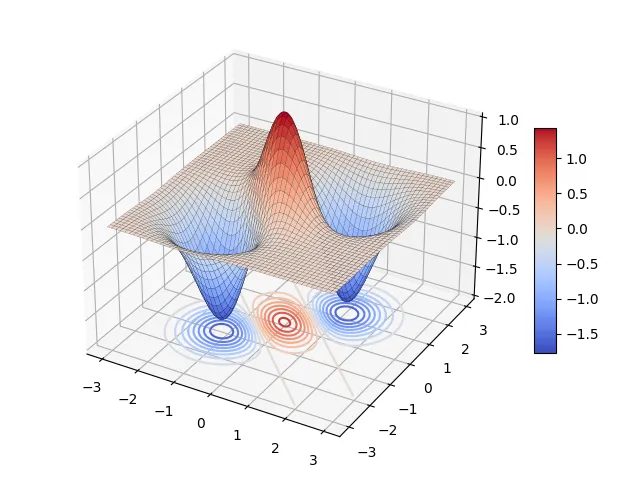
使用plot_surface和contour一起来投影等高线。它不仅限于Z平面,你也可以在X和Y平面上这样做。
Matplotlib的官方文档中有一个例子:https://matplotlib.org/stable/gallery/mplot3d/contourf3d_2.html#sphx-glr-gallery-mplot3d-contourf3d-2-py
请注意,需要一个偏移量将等高线移动到3D图的底部。你可以将偏移量设置为y轴限制的下界。
我创建了一个例子:
import matplotlib.pyplot as plt
import numpy as np

x = y = np.arange(-3.0, 3.0, 0.02)
X, Y = np.meshgrid(x, y)
Z1 = np.exp(-X ** 2 - Y ** 2)
Z2 = np.exp(-(X - 1) ** 2 - (Y - 1) ** 2)
Z3 = np.exp(-(X + 1) ** 2 - (Y + 1) ** 2)
Z = (Z1 - Z2 - Z3) * 2

fig, ax = plt.subplots(subplot_kw={"projection": "3d"})

# draw surface plot
surf = ax.plot_surface(X, Y, Z, lw=0.1, cmap='coolwarm', edgecolor='k')

# add color bar
fig.colorbar(surf, shrink=0.5, aspect=10)

# projecting the contour with an offset
ax.contour(X, Y, Z, 20, zdir='z', offset=-2, cmap='coolwarm')

# match the lower bound of zlim to the offset
ax.set(zlim=(-2, 1))

plt.tight_layout()
plt.show()