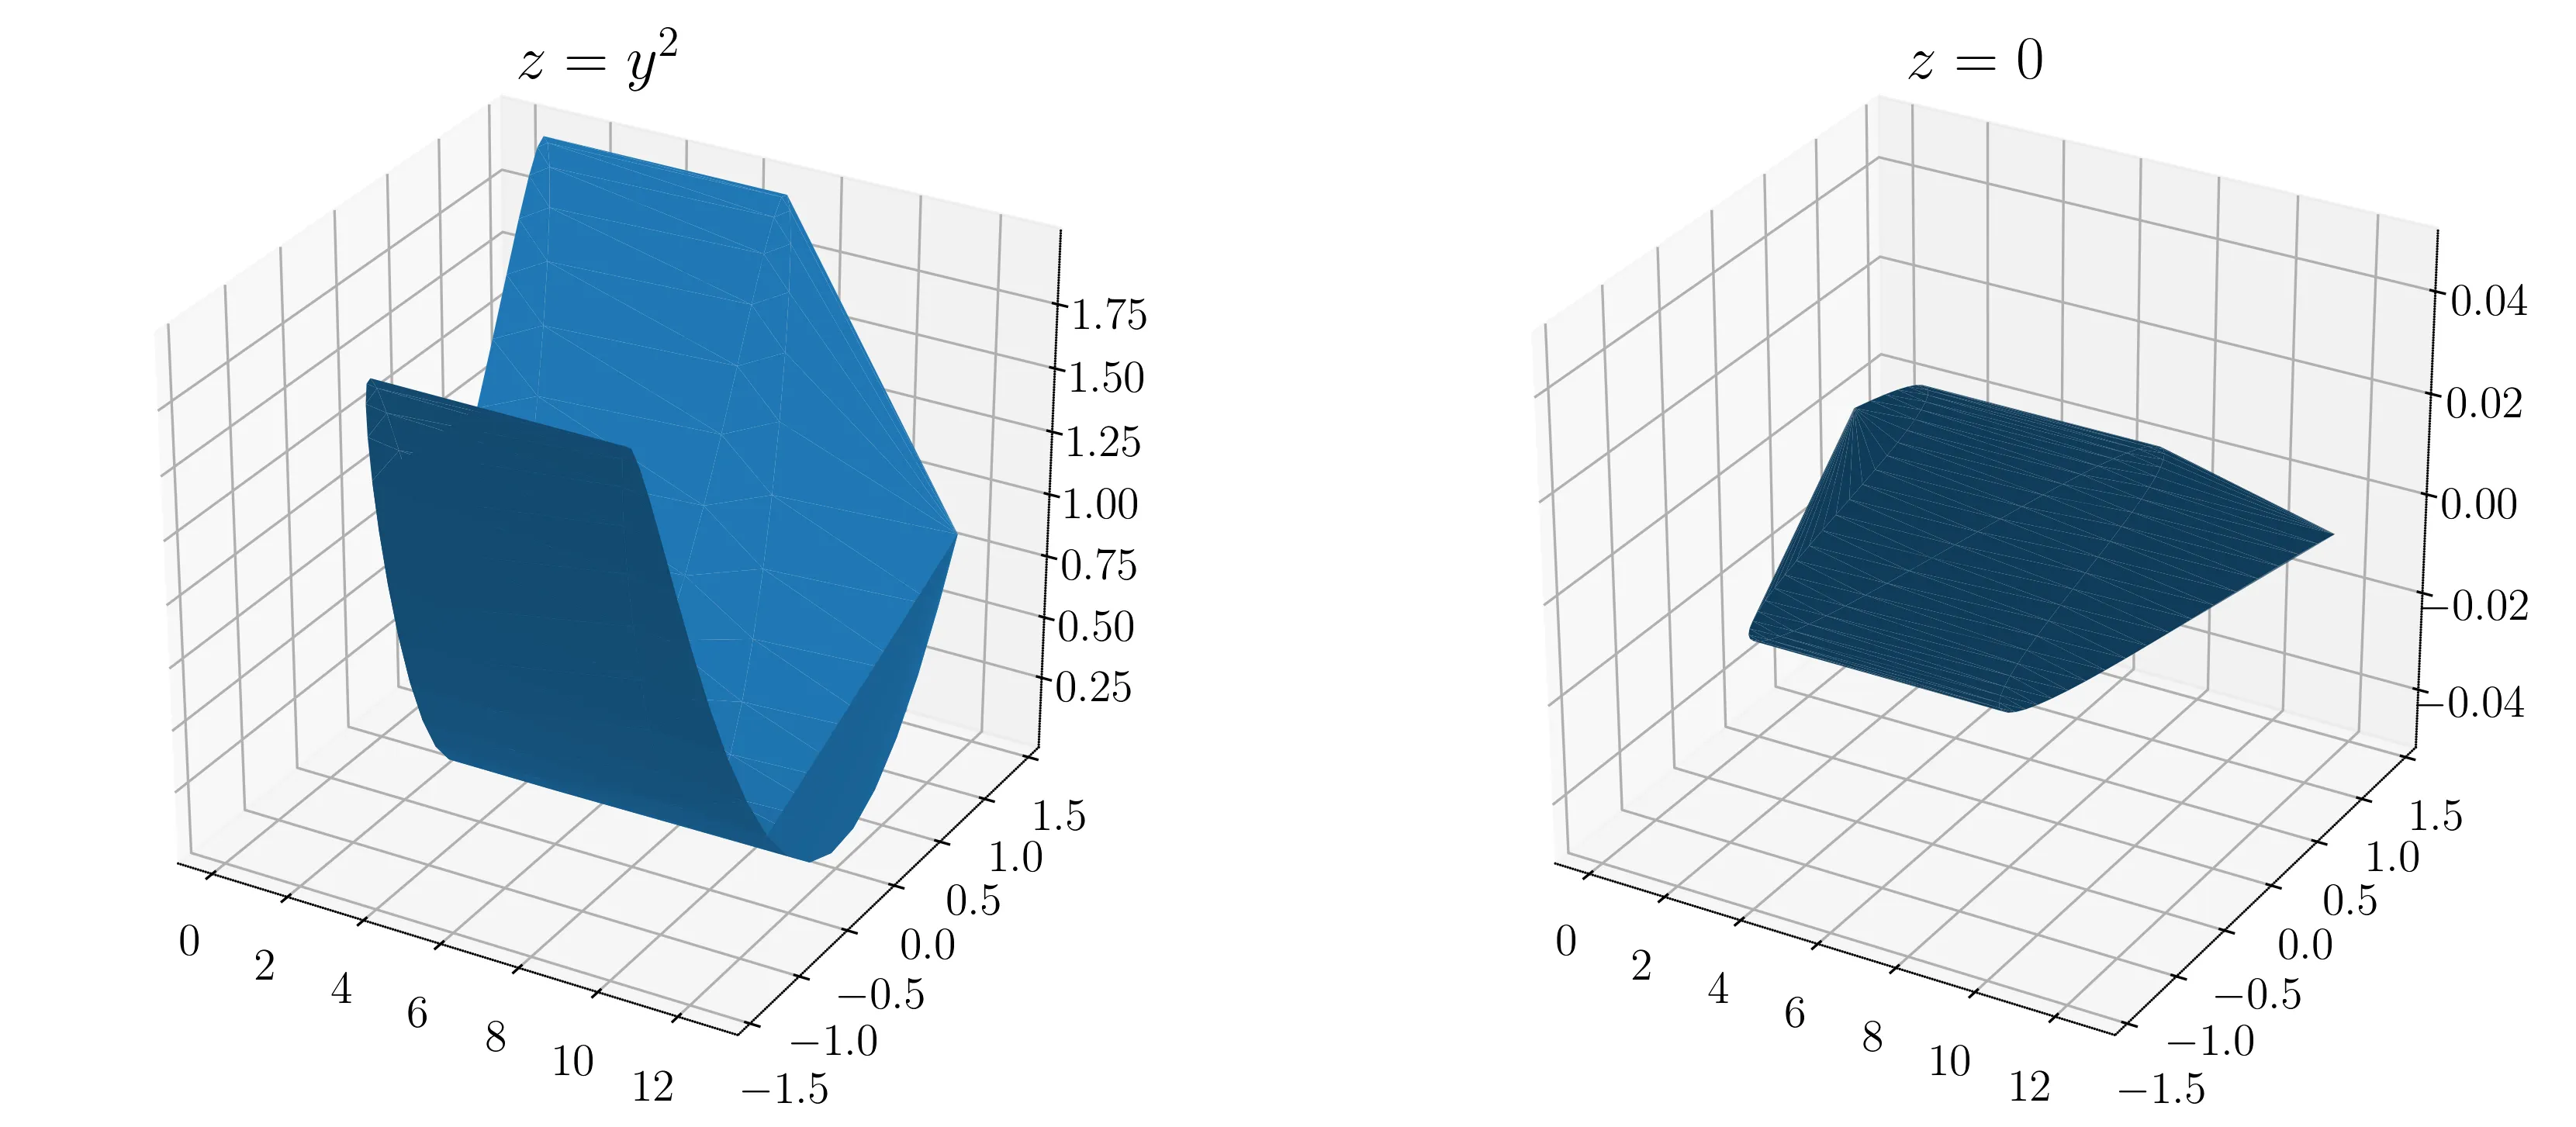
对于任意的表面,投影是很简单的,只需将所有的z值设置为0即可。
import matplotlib.pyplot as plt
from mpl_toolkits.mplot3d import Axes3D
import numpy as np

fig = plt.figure()
ax1 = fig.add_subplot(121, projection='3d')
ax2 = fig.add_subplot(122, projection='3d')

n=100
x = np.linspace(0, np.pi*4, n)
y = np.sin(x)+np.cos(x)
z = y*y

ax1.plot_trisurf(x, y, z)
ax1.set_title(r"$z=y^2$")
ax2.plot_trisurf(x, y, np.zeros_like(x))
ax2.set_title(r"$z=0$")
plt.show()
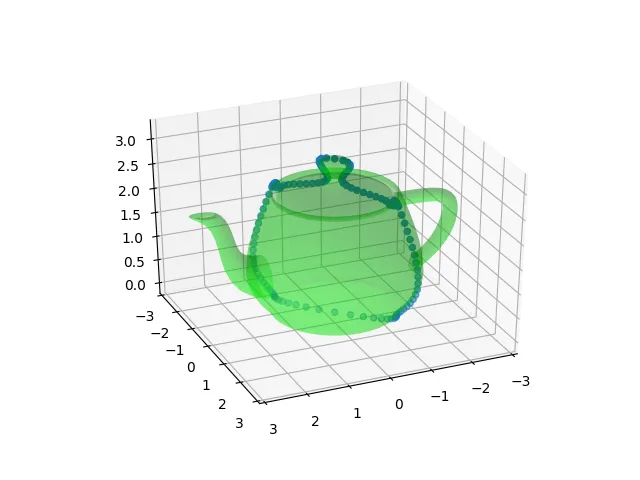
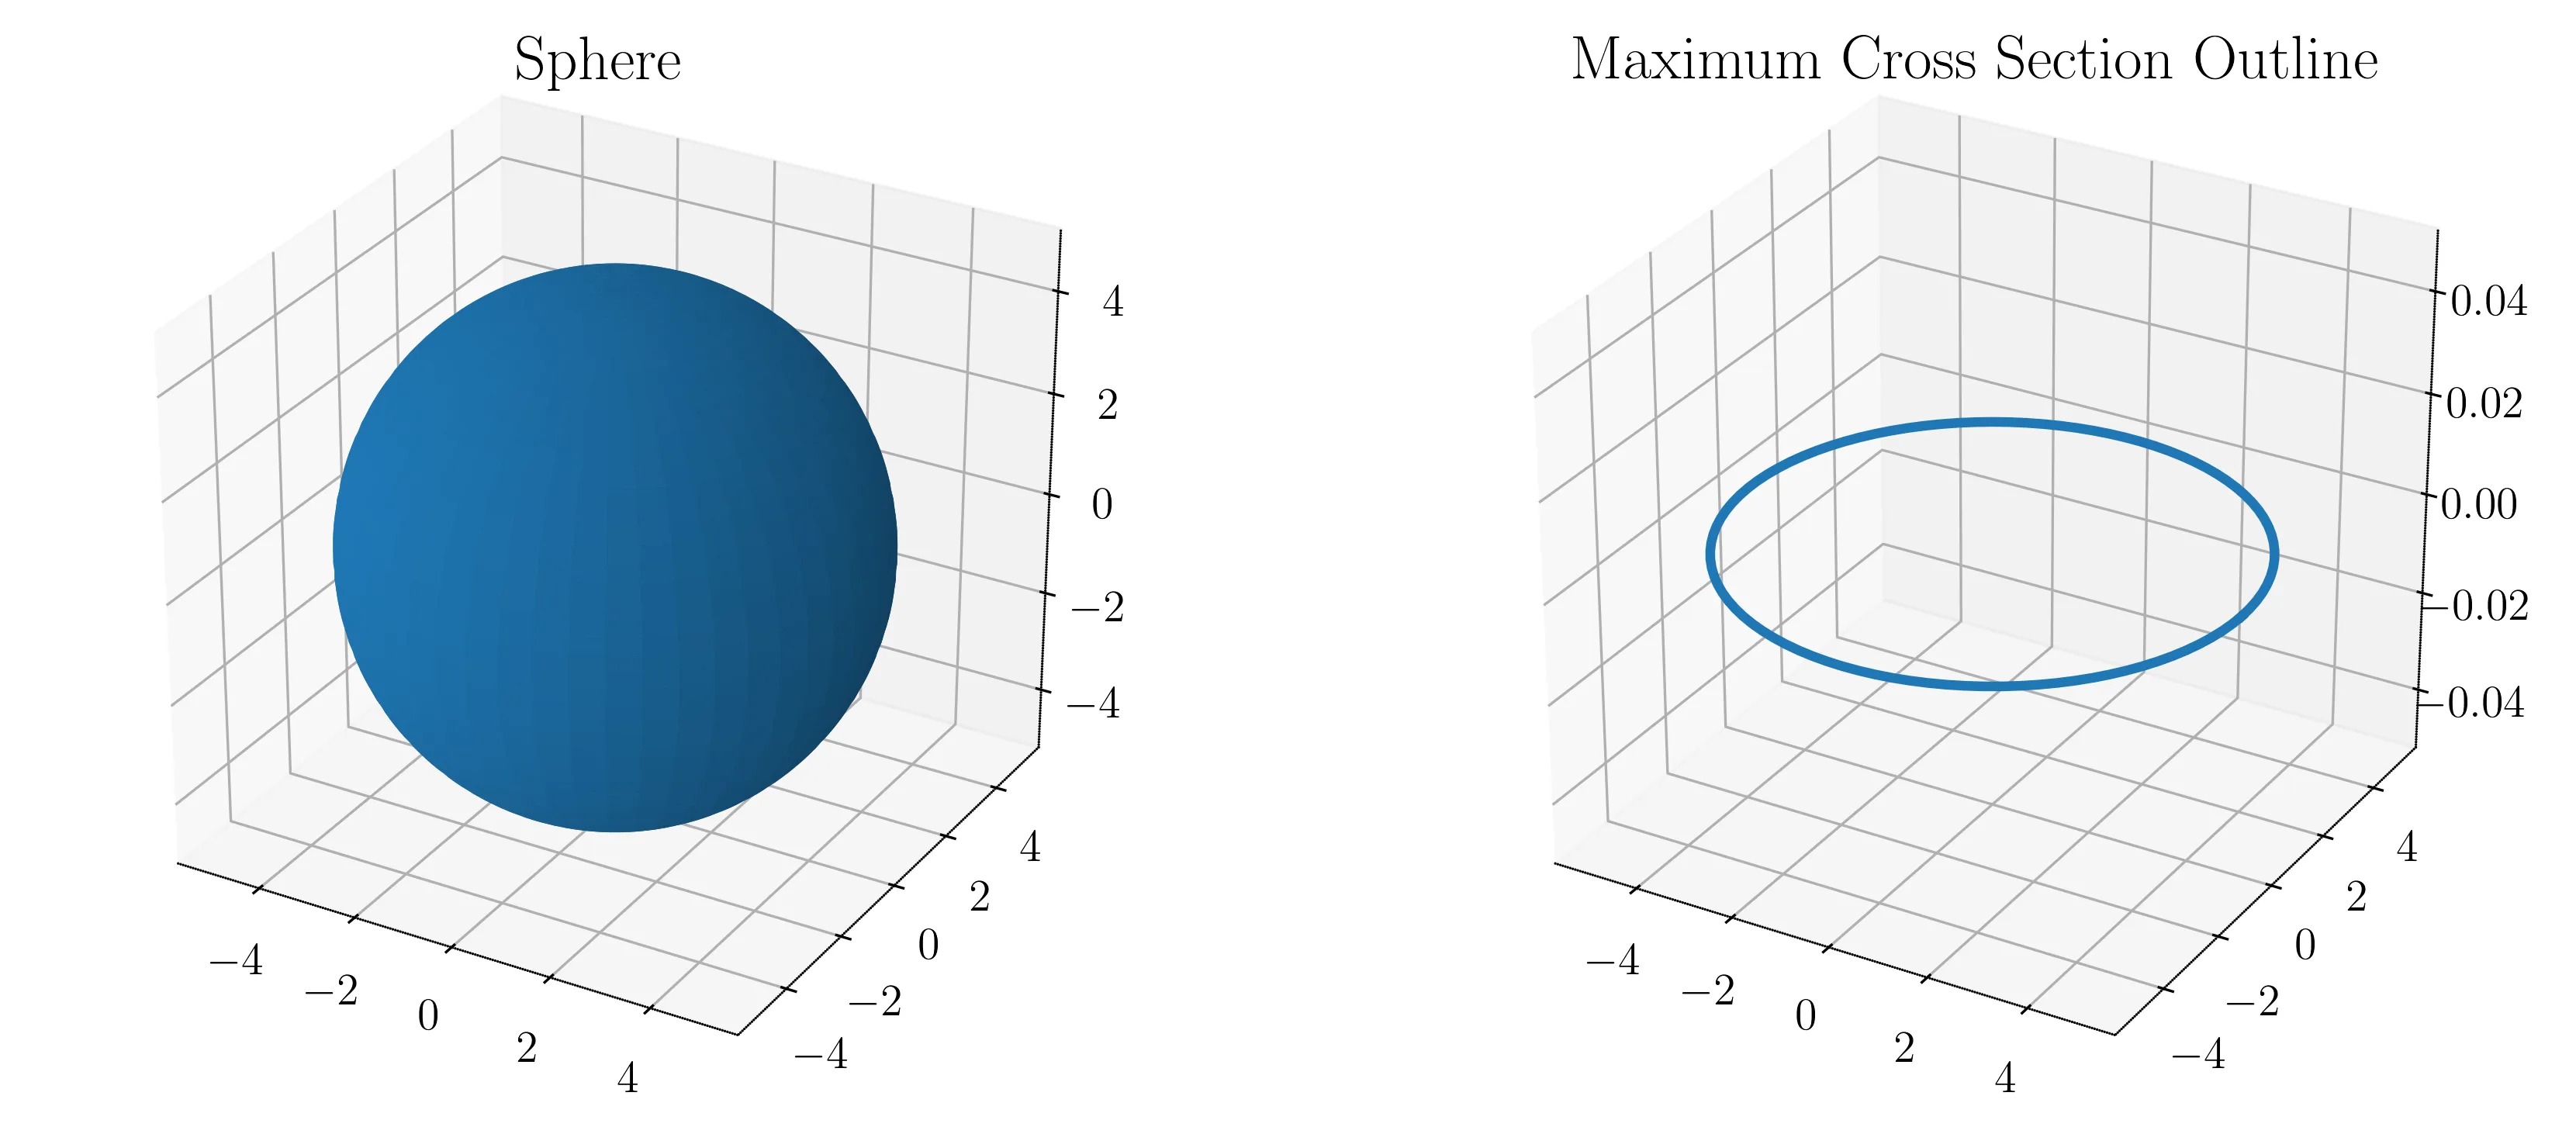
对于已知的常规曲面,如球体,可以通过与给定方向相对应的最大横截面来简单地处理。即对于以原点为中心的圆,仅使用x和y对,使得z==0或abs(z) < threshold,或使垂直于yx平面的竖直线上的z最小。如果球体已经被“压扁”,则该方法不适用。例如,使用后一种方法(但使用plot_surface,因为我已经有了它的代码,并使用上述相同的导言语句),
n = 100
r = 5
theta = np.linspace(0, np.pi*2, n)
phi = np.linspace(0, np.pi, n)
x = r * np.outer(np.cos(theta), np.sin(phi))
y = r * np.outer(np.sin(theta), np.sin(phi))
z = r * np.outer(np.ones_like(theta), np.cos(phi))

x_out = list()
y_out = list()
for t in theta:
    zm = r
    idx = 0
    for ii in range(len(phi)):
        if abs(r * np.cos(phi[ii])) < zm:
            zm = r * np.cos(phi[ii])
            idx = ii
    x_out.append(r * np.cos(t) * np.sin(phi[idx]))
    y_out.append(r * np.sin(t) * np.sin(phi[idx]))

ax1.plot_surface(x, y, z)
ax1.set_title("Sphere")
ax2.plot(x_out, y_out, np.zeros_like(x_out), linestyle='-')
ax2.set_title("Maximum Cross Section Outline")
plt.show()
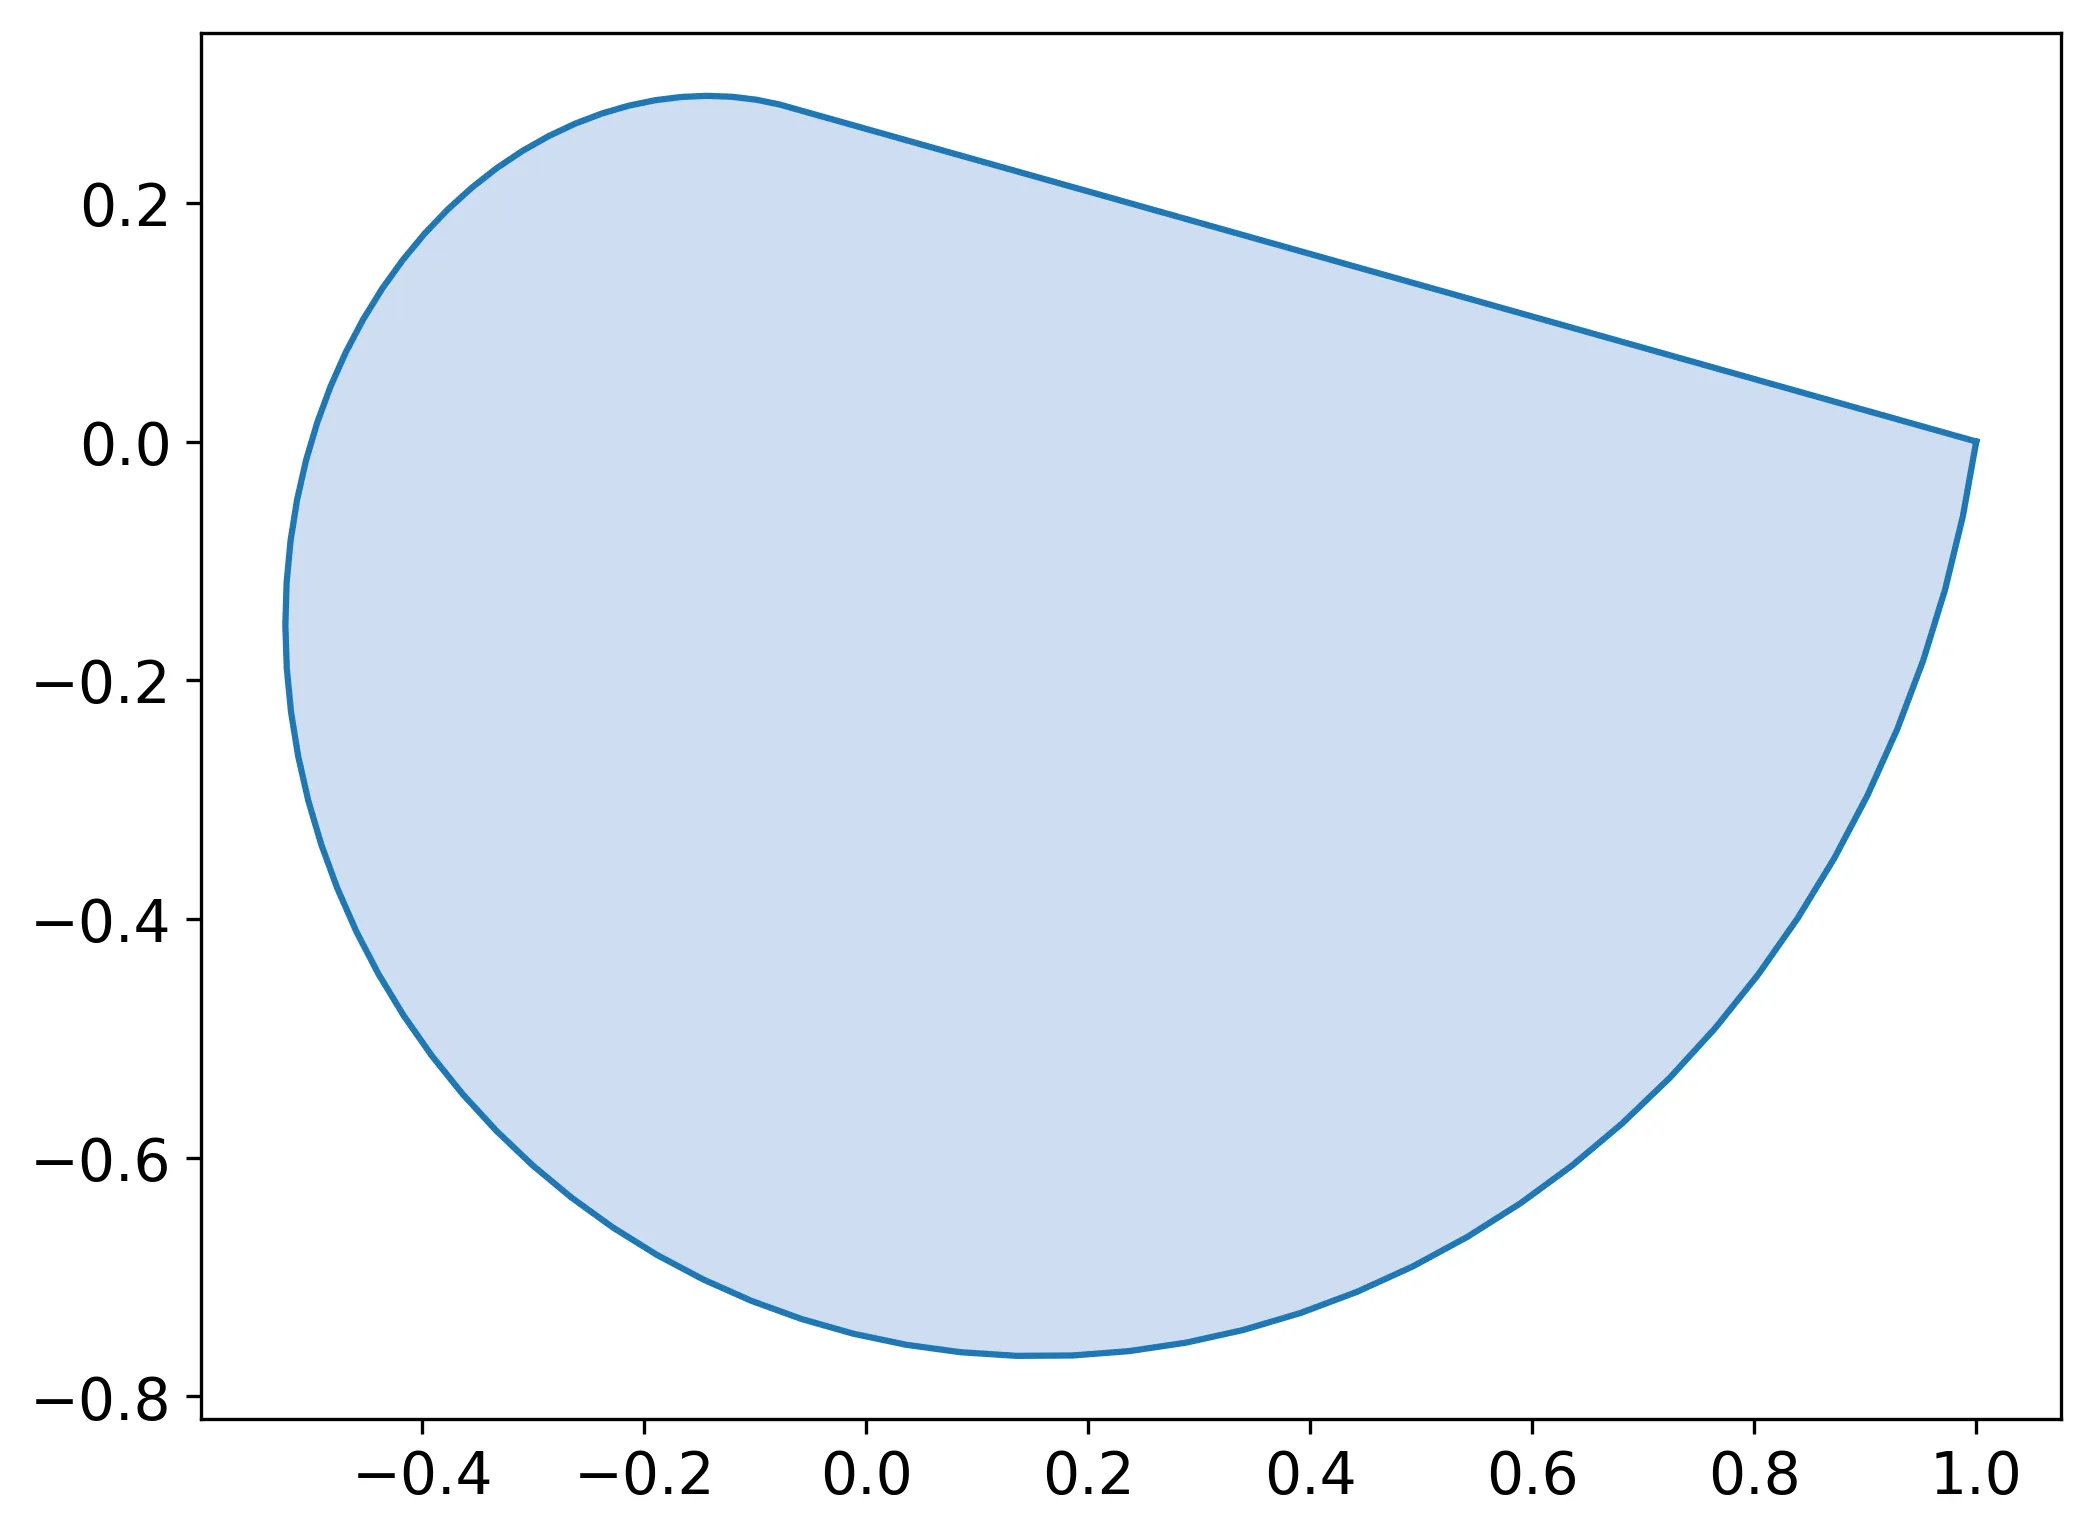
有些不规则表面也可以使用此方法,但如果点的极坐标分布不均匀,则可能需要插值。更可靠且计算密集的方法是使用cascaded_union创建shapely。要推广此方法,必须进行一些过滤以删除shapely认为无效的多边形,即具有自交的多边形。您可以使用以下方式完成此操作:
import matplotlib.pyplot as plt
from mpl_toolkits.mplot3d import Axes3D
import numpy as np
from matplotlib import rcParams
from math import cos, sin
from shapely.ops import cascaded_union
from shapely import geometry
from matplotlib import patches
n=100
t = np.linspace(0, np.pi*2, n)
r = np.linspace(0, 1.0, n)
x = r * np.cos(t)
y = r * np.sin(t)
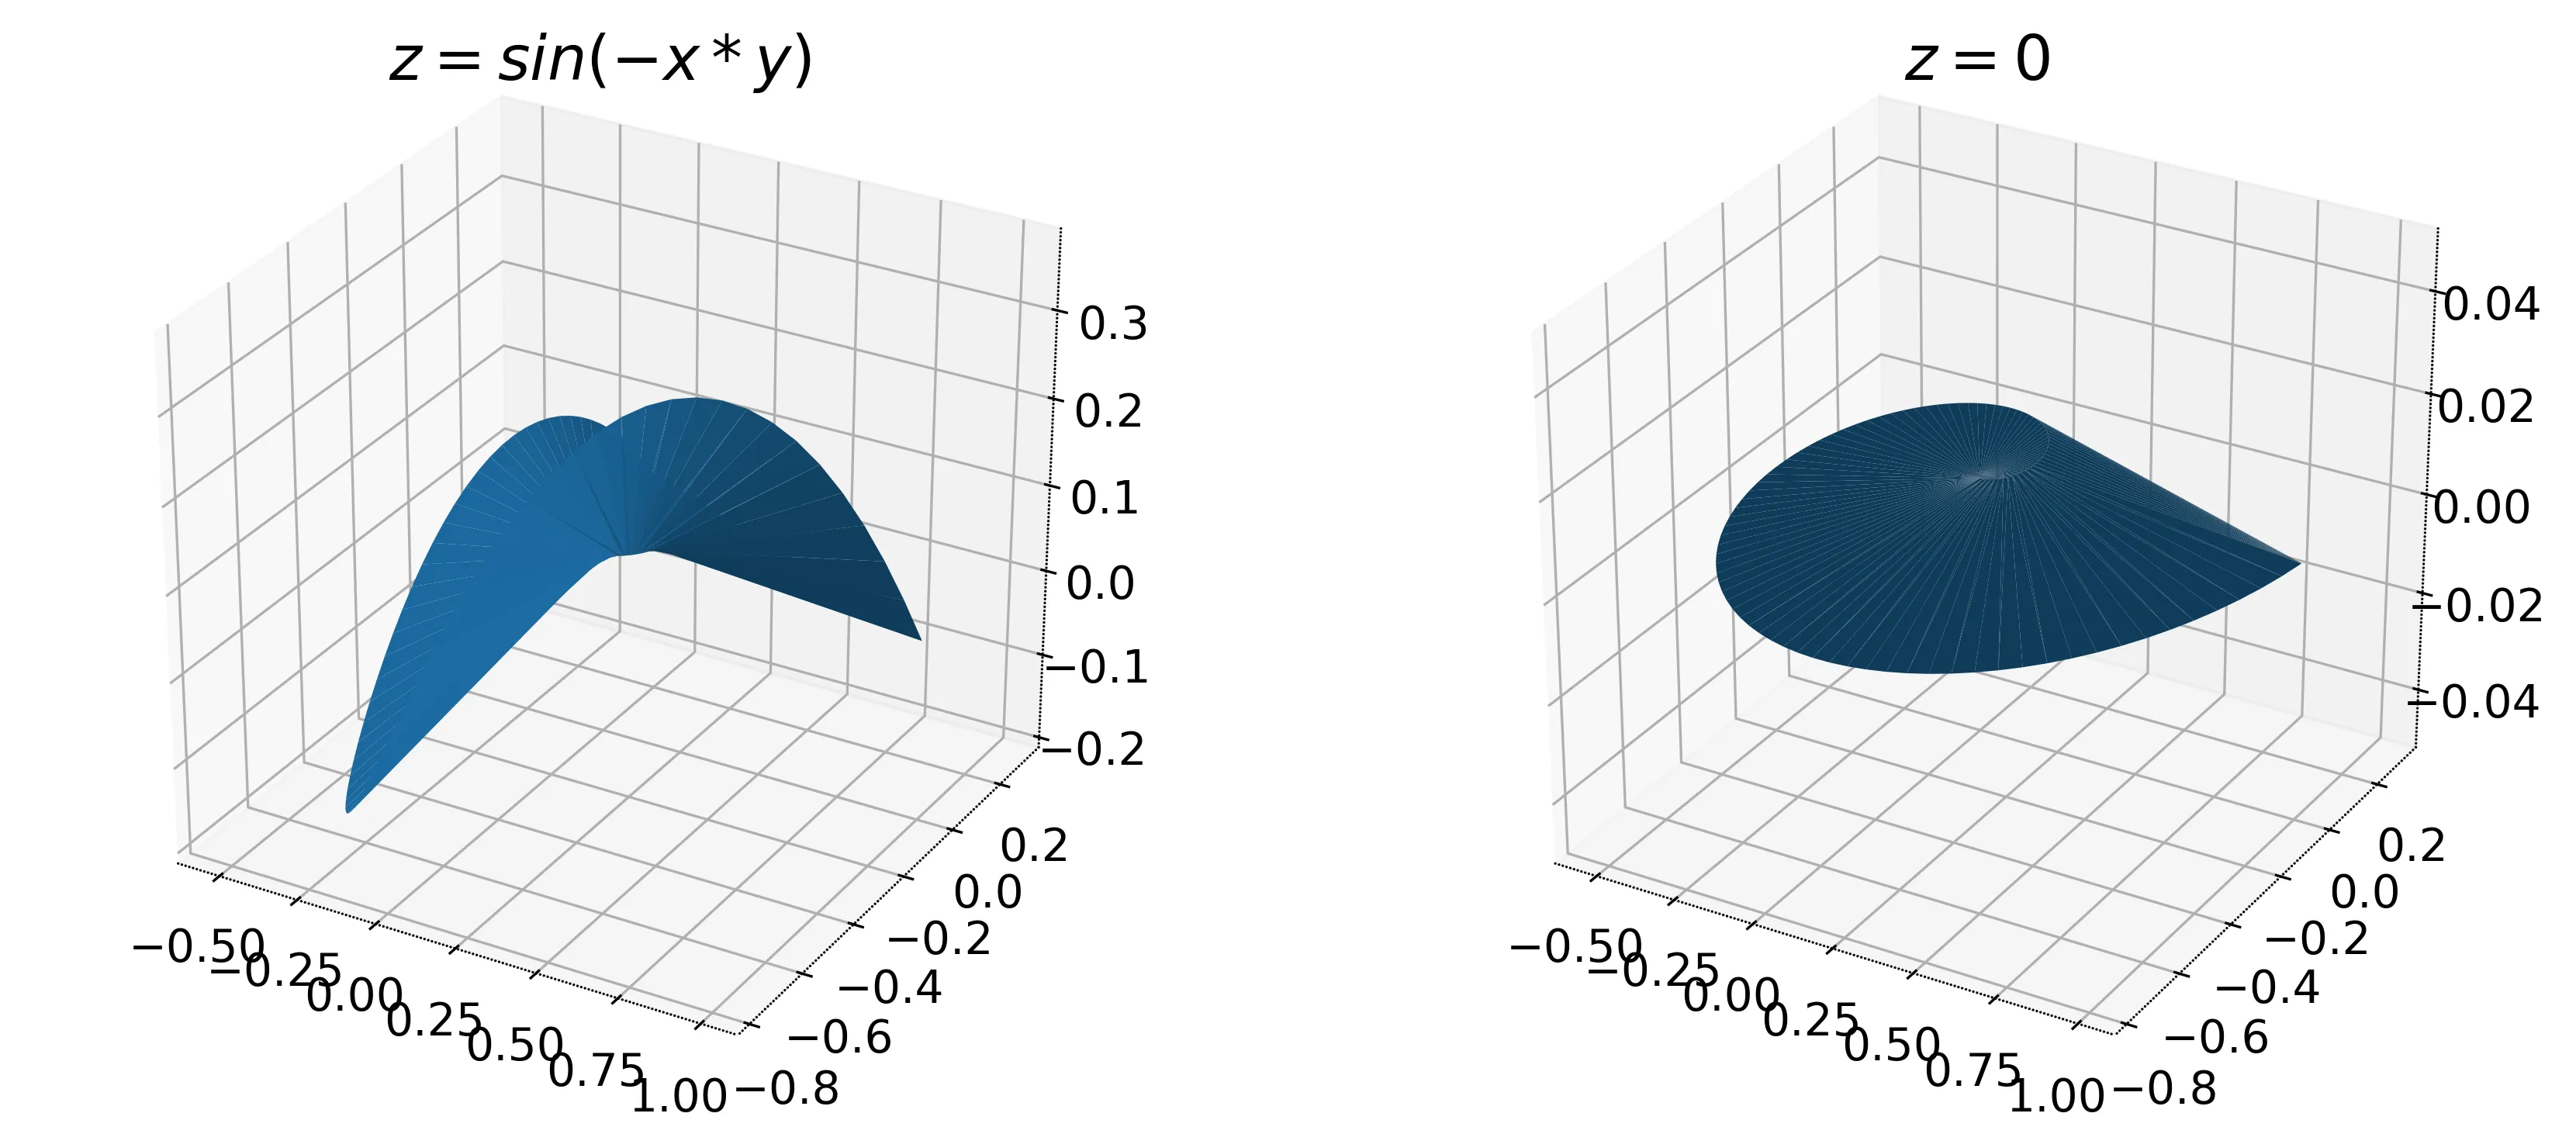
z = np.sin(-x*y)
fig = plt.figure()
ax1 = fig.add_subplot(121, projection='3d')
ax2 = fig.add_subplot(122, projection='3d')
polygons = list()
for k in range(1, len(x)):
for j in range(1, len(x)):
try:
polygons.append(geometry.Polygon([(x[k], y[k]), (x[k-1], y[k-1]),
(x[j], y[j]), (x[j-1], y[j-1])]))
except (ValueError, Exception):
pass
union = geometry.Polygon([])
for polygon in polygons:
try:
union = cascaded_union([polygon, union])
except ValueError:
pass
xp, yp = union.exterior.xy
ax1.plot_trisurf(x, y, z)
ax1.set_title(r"$z=sin(-x*y)$")
ax2.plot_trisurf(x, y, np.zeros_like(x))
ax2.set_title(r"$z=0$")
plt.show()
fig, ax = plt.subplots(1, figsize=(8, 6))
ax.add_patch(patches.Polygon(np.stack([xp, yp], 1), alpha=0.6))
ax.plot(xp, yp, '-', linewidth=1.5)
plt.show()