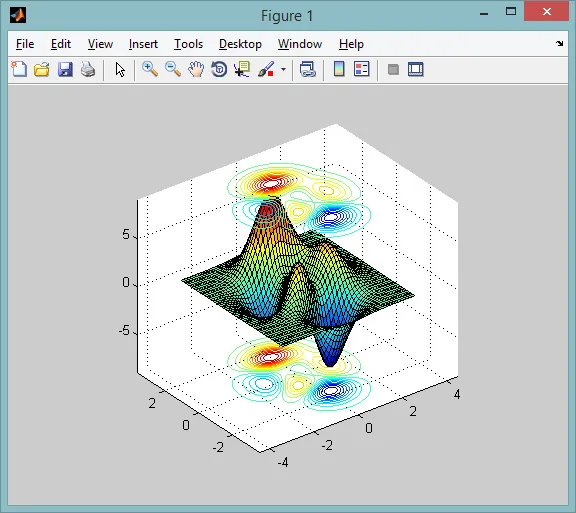
我想知道如何在 3D 图中绘制多个间隔在 z 轴上的 2D 等高线图,就像这样的图示所示:

注意:本答案的第一部分适用于HG1图形。如果您正在使用MATLAB R2014b及更高版本(HG2),请参见第二部分。
contour函数内部会创建多个patch对象,并将它们作为一个组合的hggroup对象返回。因此,我们可以通过在Z维度上移位到所需的水平(默认情况下,等高线显示在z=0)来设置所有补丁的ZData。
这是一个例子:
[X,Y,Z] = peaks;
surf(X, Y, Z), hold on       % plot surface

[~,h] = contour(X,Y,Z,20);   % plot contour at the bottom
set_contour_z_level(h, -9)
[~,h] = contour(X,Y,Z,20);   % plot contour at the top
set_contour_z_level(h, +9)

hold off
view(3); axis vis3d; grid on
这是上面使用的set_contour_z_level函数的代码:
function set_contour_z_level(h, zlevel)
    % check that we got the correct kind of graphics handle
    assert(isa(handle(h), 'specgraph.contourgroup'), ...
        'Expecting a handle returned by contour/contour3');
    assert(isscalar(zlevel));

    % handle encapsulates a bunch of child patch objects
    % with ZData set to empty matrix
    hh = get(h, 'Children');
    for i=1:numel(hh)
        ZData = get(hh(i), 'XData');   % get matrix shape
        ZData(:) = zlevel;             % fill it with constant Z value
        set(hh(i), 'ZData',ZData);     % update patch
    end
end
从R2014b开始,上述解决方案已不再适用。在HG2中,等高线对象不再有任何图形对象作为子级 (为什么某些对象的Children属性为空?)。
幸运的是,等高线的一个隐藏属性叫做ContourZLevel,可以轻松修复。您可以在此处了解更多和这里关于未记录的等高线绘图自定义。
所以先前的示例变得非常简单:
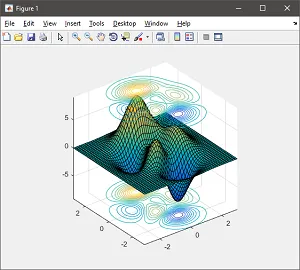
[X,Y,Z] = peaks;
surf(X, Y, Z), hold on       % plot surface

[~,h] = contour(X,Y,Z,20);   % plot contour at the bottom
h.ContourZLevel = -9;
[~,h] = contour(X,Y,Z,20);   % plot contour at the top
h.ContourZLevel = +9;

hold off
view(3); axis vis3d; grid on
另一种适用于所有版本的解决方案是将轮廓“父级化”到hgtransform对象中,并使用简单的z-平移进行变换。代码如下:
t = hgtransform('Parent',gca);
[~,h] = contour(X,Y,Z,20, 'Parent',t);
set(t, 'Matrix',makehgtform('translate',[0 0 9]));
view(az,el)进行编程控制:http://www.mathworks.com/help/matlab/visualize/setting-the-viewpoint-with-azimuth-and-elevation.html。您还可以[控制相机](http://www.mathworks.com/help/matlab/visualize/view-control-with-the-camera-toolbar.html),以获得更大的灵活性。 - Amro