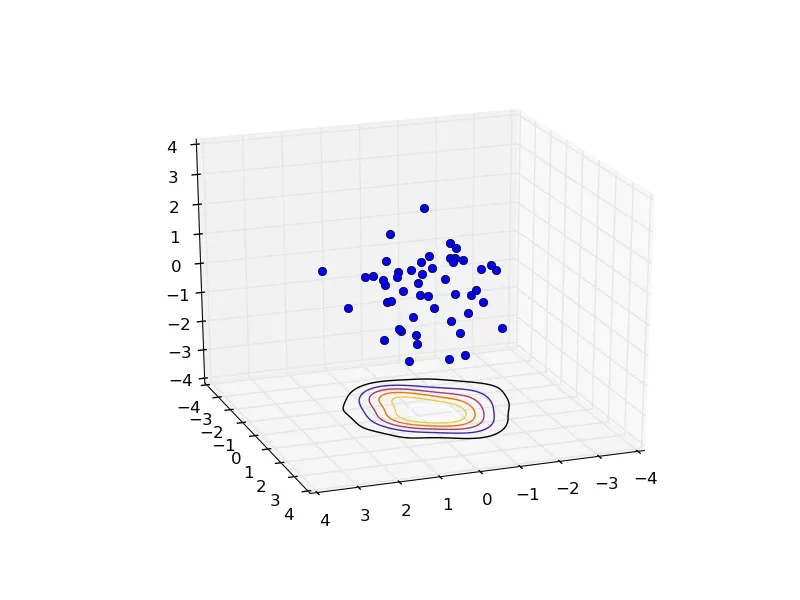
我在三维空间中有一组点云,并估计了这些点的某种分布(也是在三维空间中;使用核密度估计,但这与本问题无关)。我想将该分布的投影作为轮廓图绘制到所有三个轴(x、y和z)上。对于z轴来说,这很容易实现(即在具有相同z坐标的平面上进行投影):
import numpy as np
import scipy as sp
import scipy.stats
import matplotlib.pyplot as plt
from mpl_toolkits.mplot3d import axes3d

# generate some points of a 3D Gaussian
points = np.random.normal(size=(3, 50))

# do kernel density estimation to get smooth estimate of distribution
# make grid of points
x, y, z = np.mgrid[-4:4:100j, -4:4:100j, -4:4:100j]
kernel = sp.stats.gaussian_kde(points)
positions = np.vstack((x.ravel(), y.ravel(), z.ravel()))
density = np.reshape(kernel(positions).T, x.shape)

# now density is 100x100x100 ndarray

# plot points
ax = plt.subplot(projection='3d')
ax.plot(points[0,:], points[1,:], points[2,:], 'o')

# plot projection of density onto z-axis
plotdat = np.sum(density, axis=2)
plotdat = plotdat / np.max(plotdat)
plotx, ploty = np.mgrid[-4:4:100j, -4:4:100j]
ax.contour(plotx, ploty, plotdat, offset=-4)

ax.set_xlim((-4, 4))
ax.set_ylim((-4, 4))
ax.set_zlim((-4, 4))
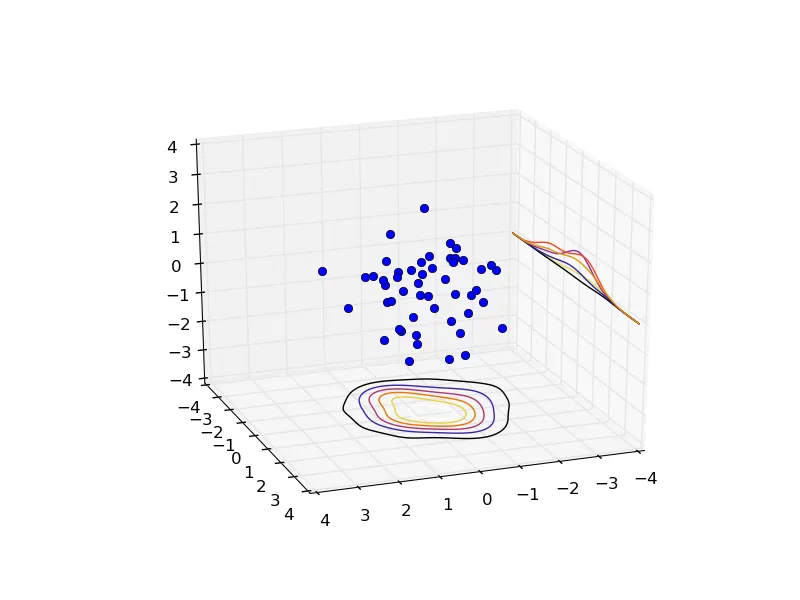
然而,在Matplotlib中似乎没有实现对其他轴进行此操作的功能。如果我使用this example中概述的方法,并指定zdir关键字参数:
# plot projection of density onto x-axis
plotdat = np.sum(density, axis=0)
plotdat = plotdat / np.max(plotdat)
ploty, plotz = np.mgrid[-4:4:100j, -4:4:100j]
ax.contour(ploty, plotz, plotdat, offset=-4, zdir='x')
轮廓的生成是沿着另一张切片进行的,可以这么说:
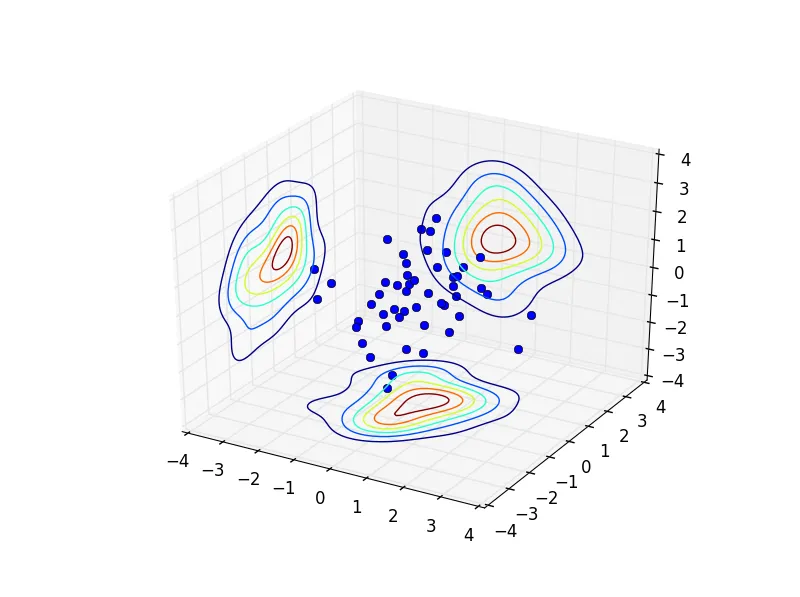
而我想要的是像这样的东西(糟糕的绘画技巧;希望这个想法很清楚):
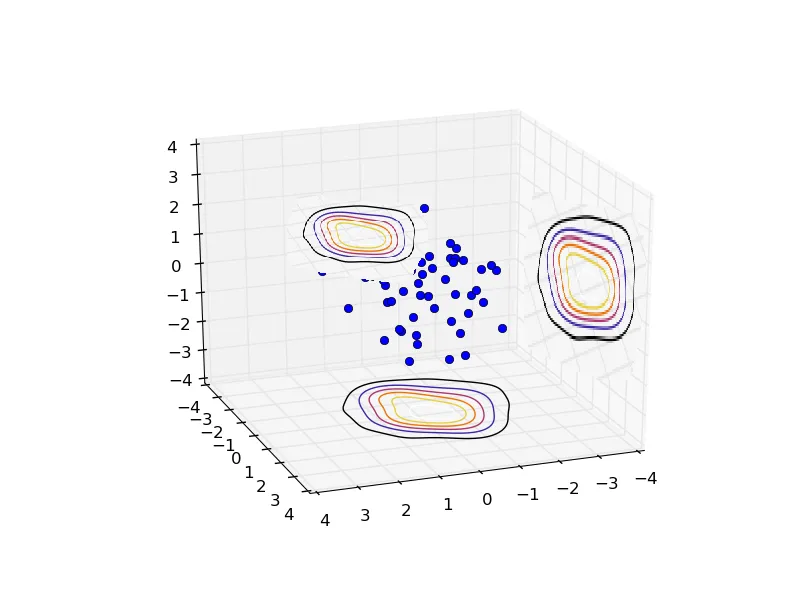
zdir='z'生成轮廓,然后在3D空间中旋转结果曲线,但是我不知道该如何处理。如果您能给我任何指导,我将非常感激!