使用imshow绘制matplotlib图中x轴上的日期

24

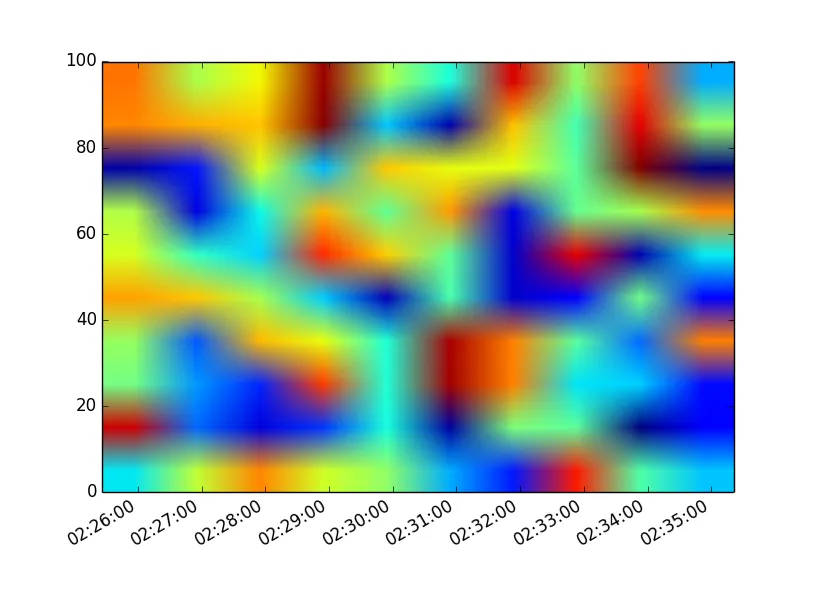
我刚开始使用matplotlib进行编程,创建了一个使用imshow()和数组的颜色图。起初,轴仅为数组的行和列编号。我使用extent = (xmin,xmax,ymin,ymax)将x轴分别设置为unix时间和海拔。

现在我想把x轴从unix时间(982376726, 982377321)改为UT(02:25:26, 02:35:21)。我已经创建了一个HH:MM:SS时间范围的列表,但不确定如何用这些新数字替换当前的x轴,而不改变颜色图(或使其消失)。

我看过datetime.time文档但仍感到困惑。

非常感谢任何帮助!


你能提供一下你目前的代码吗? - Ffisegydd
1个回答

40

我已经编写了一些示例代码,应该可以帮助您解决问题。

代码首先使用numpy.random生成一些随机数据。然后计算您的x限制和y限制,其中x限制将基于问题中给出的两个unix时间戳,而y限制只是通用数字。

然后,代码绘制随机数据,并使用pyplot方法将x轴格式转换为漂亮的字符串(而不是unix时间戳或数组编号)。

代码有良好的注释,应该可以解释您需要的一切,如果不能,请在评论中请求澄清。

import numpy as np
import matplotlib.pyplot as plt

import matplotlib.dates as mdates

import datetime as dt

# Generate some random data for imshow
N = 10
arr = np.random.random((N, N))

# Create your x-limits. Using two of your unix timestamps you first
# create a list of datetime.datetime objects using map.
x_lims = list(map(dt.datetime.fromtimestamp, [982376726, 982377321]))

# You can then convert these datetime.datetime objects to the correct
# format for matplotlib to work with.
x_lims = mdates.date2num(x_lims)

# Set some generic y-limits.
y_lims = [0, 100]

fig, ax = plt.subplots()

# Using ax.imshow we set two keyword arguments. The first is extent.
# We give extent the values from x_lims and y_lims above.
# We also set the aspect to "auto" which should set the plot up nicely.
ax.imshow(arr, extent = [x_lims[0], x_lims[1],  y_lims[0], y_lims[1]], 
          aspect='auto')

# We tell Matplotlib that the x-axis is filled with datetime data, 
# this converts it from a float (which is the output of date2num) 
# into a nice datetime string.
ax.xaxis_date()

# We can use a DateFormatter to choose how this datetime string will look.
# I have chosen HH:MM:SS though you could add DD/MM/YY if you had data
# over different days.
date_format = mdates.DateFormatter('%H:%M:%S')

ax.xaxis.set_major_formatter(date_format)

# This simply sets the x-axis data to diagonal so it fits better.
fig.autofmt_xdate()

plt.show()

示例图


非常有帮助!只是为了澄清,子图是我总是需要做的东西,才能够使用图和坐标轴吗? - user3546200
不一定。您可以使用更简单的 plt.plot,但我认为您需要执行 plt.xaxis_date()。您还可能需要执行 gca().xaxis.set_major_formatter(...),其中 gca 函数仅返回当前轴对象(相当于在开头只有 fig、ax)。 - Ffisegydd
1
有没有办法让Matplotlib自动选择标签中的时间分辨率?它通常会这样做(例如,在x轴上使用plot()时),但是如果我在您的示例中省略了DateFormatter中的格式说明符,我只会得到年份(例如,[2015, 2015, 2015,...])。 - Will Vousden
2
没关系,我刚刚找到了AutoDateLocatorAutoDateFormatter - Will Vousden

网页内容由stack overflow 提供, 点击上面的
可以查看英文原文,
原文链接