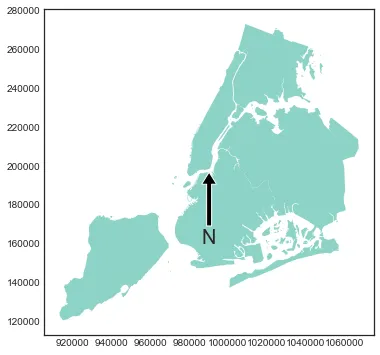
另一种可能性是创建一个优雅的多边形,并将其绘制到你的matplotlib图表中(在
这个stackoverflow问题中有一些类似的解决方案)。
注意:你必须自己定义实际的北方方向。
以下是用于转换/缩放多边形的代码。
import shapely.plotting
from shapely.geometry import Polygon
def plot_north_arrow( ax, xT=0, yT=0, scale=1 ):
def t_s(t,xT,yT,s):
x,y = t
return (xT+(x*s),yT+(y*s))
a = [(0, 5), (0, 1), (2, 0)]
b = [(0, 5), (0, 1), (-2, 0)]
t_pos = (0.25,6)
t_pos_x,t_pos_y = t_s(t_pos,xT,yT,scale)
polygon1 = Polygon( [t_s(t,xT,yT,scale) for t in a] )
polygon2 = Polygon( [t_s(t,xT,yT,scale) for t in b] )
shapely.plotting.plot_polygon(polygon1, add_points=False, ax=ax, color=None, facecolor='None', edgecolor='k', linewidth=2)
shapely.plotting.plot_polygon(polygon2, add_points=False, ax=ax, color=None, facecolor='k', edgecolor='k', linewidth=None)
ax.text(x=t_pos_x,y=t_pos_y,s='N', fontsize='medium',
ha='center',
va='center',weight='bold')
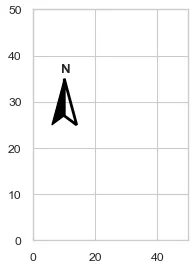
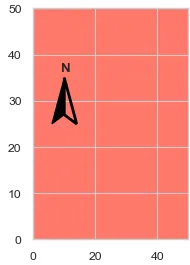
fig, ax = plt.subplots(figsize=(2,3))
plot_north_arrow( ax, xT=10, yT=25, scale=2 )
_ = ax.set_xlim(0,50)
_ = ax.set_ylim(0,50)
ax.set_facecolor((1.0, 0.47, 0.42))
我相信
Shapely.plotting 是在 v2.0.1 版本中添加的,所以你需要执行
pip install shapely==2.0.1。