我希望在folium地图中添加一个类别/数值图例,就像R中的addLenged()一样。
示例:
可重现的例子。
示例:
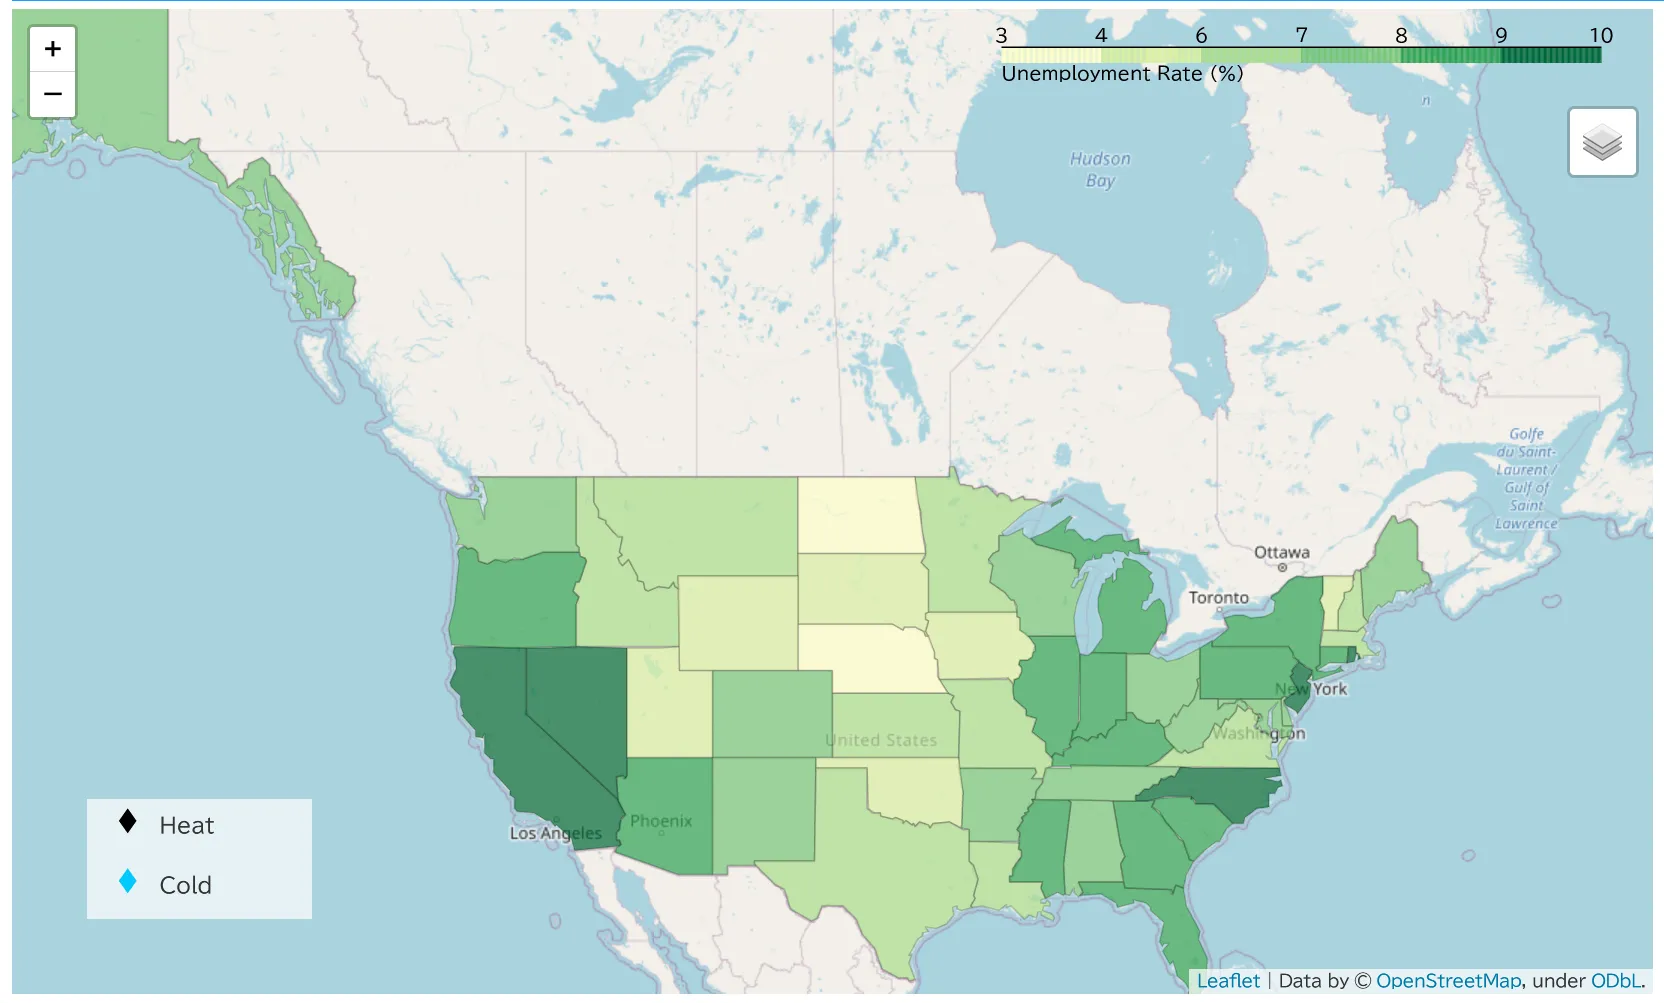
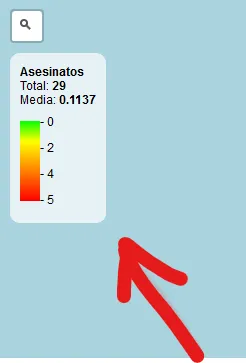
数值图例
我还想添加一个类别图例,就像这样:
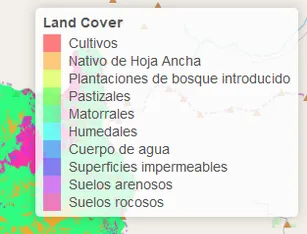
类别图例
目前我只有这段代码,我卡在尝试实现 R 中的 addLegend 功能上。
函数
def add_categorical_legend(folium_map, title, colors, labels):
if len(colors) != len(labels):
raise ValueError("colors and labels must have the same length.")
color_by_label = dict(zip(labels, colors))
legend_categories = ""
for label, color in color_by_label.items():
legend_categories += f"<li><span style='background:{color}'></span>{label}</li>"
legend_html = f"""
<div id='maplegend' class='maplegend'>
<div class='legend-title'>{title}</div>
<div class='legend-scale'>
<ul class='legend-labels'>
{legend_categories}
</ul>
</div>
</div>
"""
script = f"""
<script type="text/javascript"></script>
"""
css = """
<style type='text/css'>
.maplegend {
z-index:9999;
float:right;
background-color: rgba(255, 255, 255, 1);
border-radius: 5px;
border: 2px solid #bbb;
padding: 10px;
font-size:12px;
positon: relative;
}
.maplegend .legend-title {
text-align: left;
margin-bottom: 5px;
font-weight: bold;
font-size: 90%;
}
.maplegend .legend-scale ul {
margin: 0;
margin-bottom: 5px;
padding: 0;
float: left;
list-style: none;
}
.maplegend .legend-scale ul li {
font-size: 80%;
list-style: none;
margin-left: 0;
line-height: 18px;
margin-bottom: 2px;
}
.maplegend ul.legend-labels li span {
display: block;
float: left;
height: 16px;
width: 30px;
margin-right: 5px;
margin-left: 0;
border: 0px solid #ccc;
}
.maplegend .legend-source {
font-size: 80%;
color: #777;
clear: both;
}
.maplegend a {
color: #777;
}
</style>
"""
folium_map.get_root().header.add_child(folium.Element(script + css))
return folium_map
可重现的例子。
import folium
m = folium.Map()
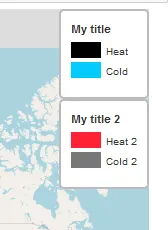
m = add_categorical_legend(m, 'My title',
colors = ['#000','#03cafc'],
labels = ['Heat', 'Cold'])
m = add_categorical_legend(m, 'My title 2',
colors = ['#F23','#777'],
labels = ['Heat 2', 'Cold 2'])
m.save("map.html")
m
结果
问题
- 然而,我做的图例与folium LayerControls存在冲突,导致它们停止工作。对我来说,这是一个非常大的问题,因为图例用于描述我在LayerControls中使用的内容。我不知道原因。
- 此外,这仅适用于分类数据。
重要
- 我希望图例可以添加到顶部|底部和右侧|左侧位置,就像R中的addLegend一样。给出绝对位置不是一个选项。
任何帮助都将不胜感激
注意:我不想使用branca颜色映射,因为我想要像图片中所示的图例。