Folium文档目前还不完整: https://folium.readthedocs.io/en/latest/
根据不完整文档的索引,支持图例和图层功能。我花了一些时间在网上寻找示例,但迄今为止什么都没找到。如果有人知道如何创建这些功能,或者能向我指出文档或教程,我将不胜感激。
Folium文档目前还不完整: https://folium.readthedocs.io/en/latest/
根据不完整文档的索引,支持图例和图层功能。我花了一些时间在网上寻找示例,但迄今为止什么都没找到。如果有人知道如何创建这些功能,或者能向我指出文档或教程,我将不胜感激。
你可以很容易地添加图例;
#specify the min and max values of your data
colormap = branca.colormap.linear.YlOrRd_09.scale(0, 8500)
colormap = colormap.to_step(index=[0, 1000, 3000, 5000, 8500])
colormap.caption = 'Incidents of Crime in Victoria (year ending June 2018)'
colormap.add_to(world_map)
您可以在此处查看完整示例:
如果在标记或折线的名称参数中添加HTML,您可以通过图层控制中的文本/标签颜色完成一半的工作:
import folium
print( folium.__version__)
import numpy as np

lon_ct = 50
fkt=10
num = 60
m = folium.Map((lon_ct, 6), tiles='stamentoner', zoom_start=6 )


lats = (lon_ct * np.cos(np.linspace(0, 2*np.pi, num))/fkt ) + lon_ct
lons = (lon_ct * np.sin(np.linspace(0, 2*np.pi, num))/fkt ) + 10
colors = np.sin(5 *    np.linspace(0, 2*np.pi, num))

lgd_txt = '<span style="color: {col};">{txt}</span>'

for idx, color in enumerate( ['red', 'blue']):  # color choice is limited
    print(color)
    fg = folium.FeatureGroup(name= lgd_txt.format( txt= color+' egg', col= color))
    pl = folium.features.PolyLine(
            list(zip(lats, lons - idx*fkt)),
            color=color,
            weight=10, )
    fg.add_child(pl)
    m.add_child( fg)

folium.map.LayerControl('topleft', collapsed= False).add_to(m)
m
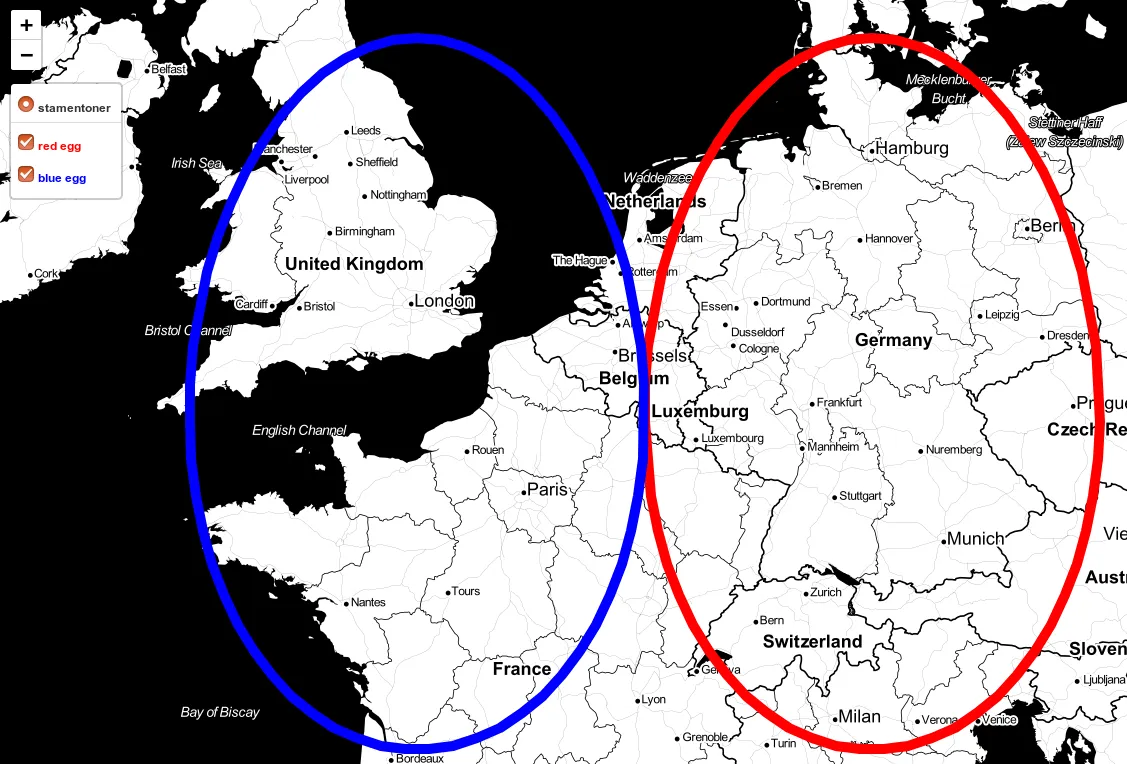
来源:html_legend
如果您了解一些HTML:
item_txt = """<br> {item} <i class="fa fa-map-marker fa-2x" style="color:{col}"></i>"""
html_itms = item_txt.format( item= "mark_1" , col= "red")
legend_html = """
<div style="
position: fixed;
bottom: 50px; left: 50px; width: 200px; height: 160px;
border:2px solid grey; z-index:9999;
background-color:white;
opacity: .85;
font-size:14px;
font-weight: bold;
">
{title}
{itm_txt}
</div> """.format( title = "Legend html", itm_txt= html_itms)
map.get_root().html.add_child(folium.Element( legend_html ))
链接 基础
链接 高级
m.get_root().html
<branca.element.Element at 0x7f5e1ca61250>
https://pypi.org/project/branca/
branca.element.Element。 - InLaw现在的Folium 0.15版本已经可以方便地添加图片了。
from folium.plugins import FloatImage
image_file = 'image.PNG'

FloatImage(image_file, bottom=0, left=86).add_to(mymap)
feature_group = FeatureGroup(name='Layer1')
feature_group2 = FeatureGroup(name='Layer2')
map = folium.Map(zoom_start=6)

# coordinates to locate your marker
COORDINATE = [(333,333)] # example coordinate
COORDINATE2 = [(444,444)]

# add marker to your map
folium.Marker(location=COORDINATE).add_to(feature_group)
folium.Marker(location=COORDINATE2).add_to(feature_group2)

map.add_child(feature_group)
map.add_child(feature_group2)

# turn on layer control
map.add_child(folium.map.LayerControl())
我有同样的问题,并使用了这个快速hack来添加图例到Folium生成的HTML中。虽然不是特别优雅,但它确实有效。由于我只需要几次这样的操作,所以我手动将图例生成为图像(legend.png),但我想如果你经常这样做,你可以创建一个脚本来自动创建图例。我在Folium输出我的地图的适当部分中添加了以下组件:
         <style> #background_img {
            position : absolute;
            background:url('legend.png');
            width : 16.9%;
            height: 17.7%;
            right: 20px;
            bottom: 50px;
            z-index: 99;
            background-repeat: no-repeat;
            background-size: contain;
            }
        </style>

        <div id="background_img" class="backgroundimg" ></div>
您还需要更改地图样式元素的 z-index 值,将其设置为小于 99,以便图例位于地图上方。