如何在Seaborn facetgrid条形图上添加图例

12

我有以下代码:

import numpy as np
import pandas as pd
import matplotlib
matplotlib.use('Agg')
import matplotlib.pyplot as plt
matplotlib.style.use('ggplot')
import seaborn as sns

sns.set(style="white")

# Create a dataset with many short random walks
rs = np.random.RandomState(4)
pos = rs.randint(-1, 2, (10, 5)).cumsum(axis=1)
pos -= pos[:, 0, np.newaxis]
step = np.tile(range(5), 10)
walk = np.repeat(range(10), 5)
df = pd.DataFrame(np.c_[pos.flat, step, walk],
                  columns=["position", "step", "walk"])


# Initialize a grid of plots with an Axes for each walk
grid = sns.FacetGrid(df, col="walk", hue="walk", col_wrap=5, size=5,
        aspect=1)


# Draw a bar plot to show the trajectory of each random walk
grid.map(sns.barplot, "step", "position", palette="Set3").add_legend();

grid.savefig("/Users/mymacmini/Desktop/test_fig.png")
#sns.plt.show()

这使得这个图表变成:

enter image description here

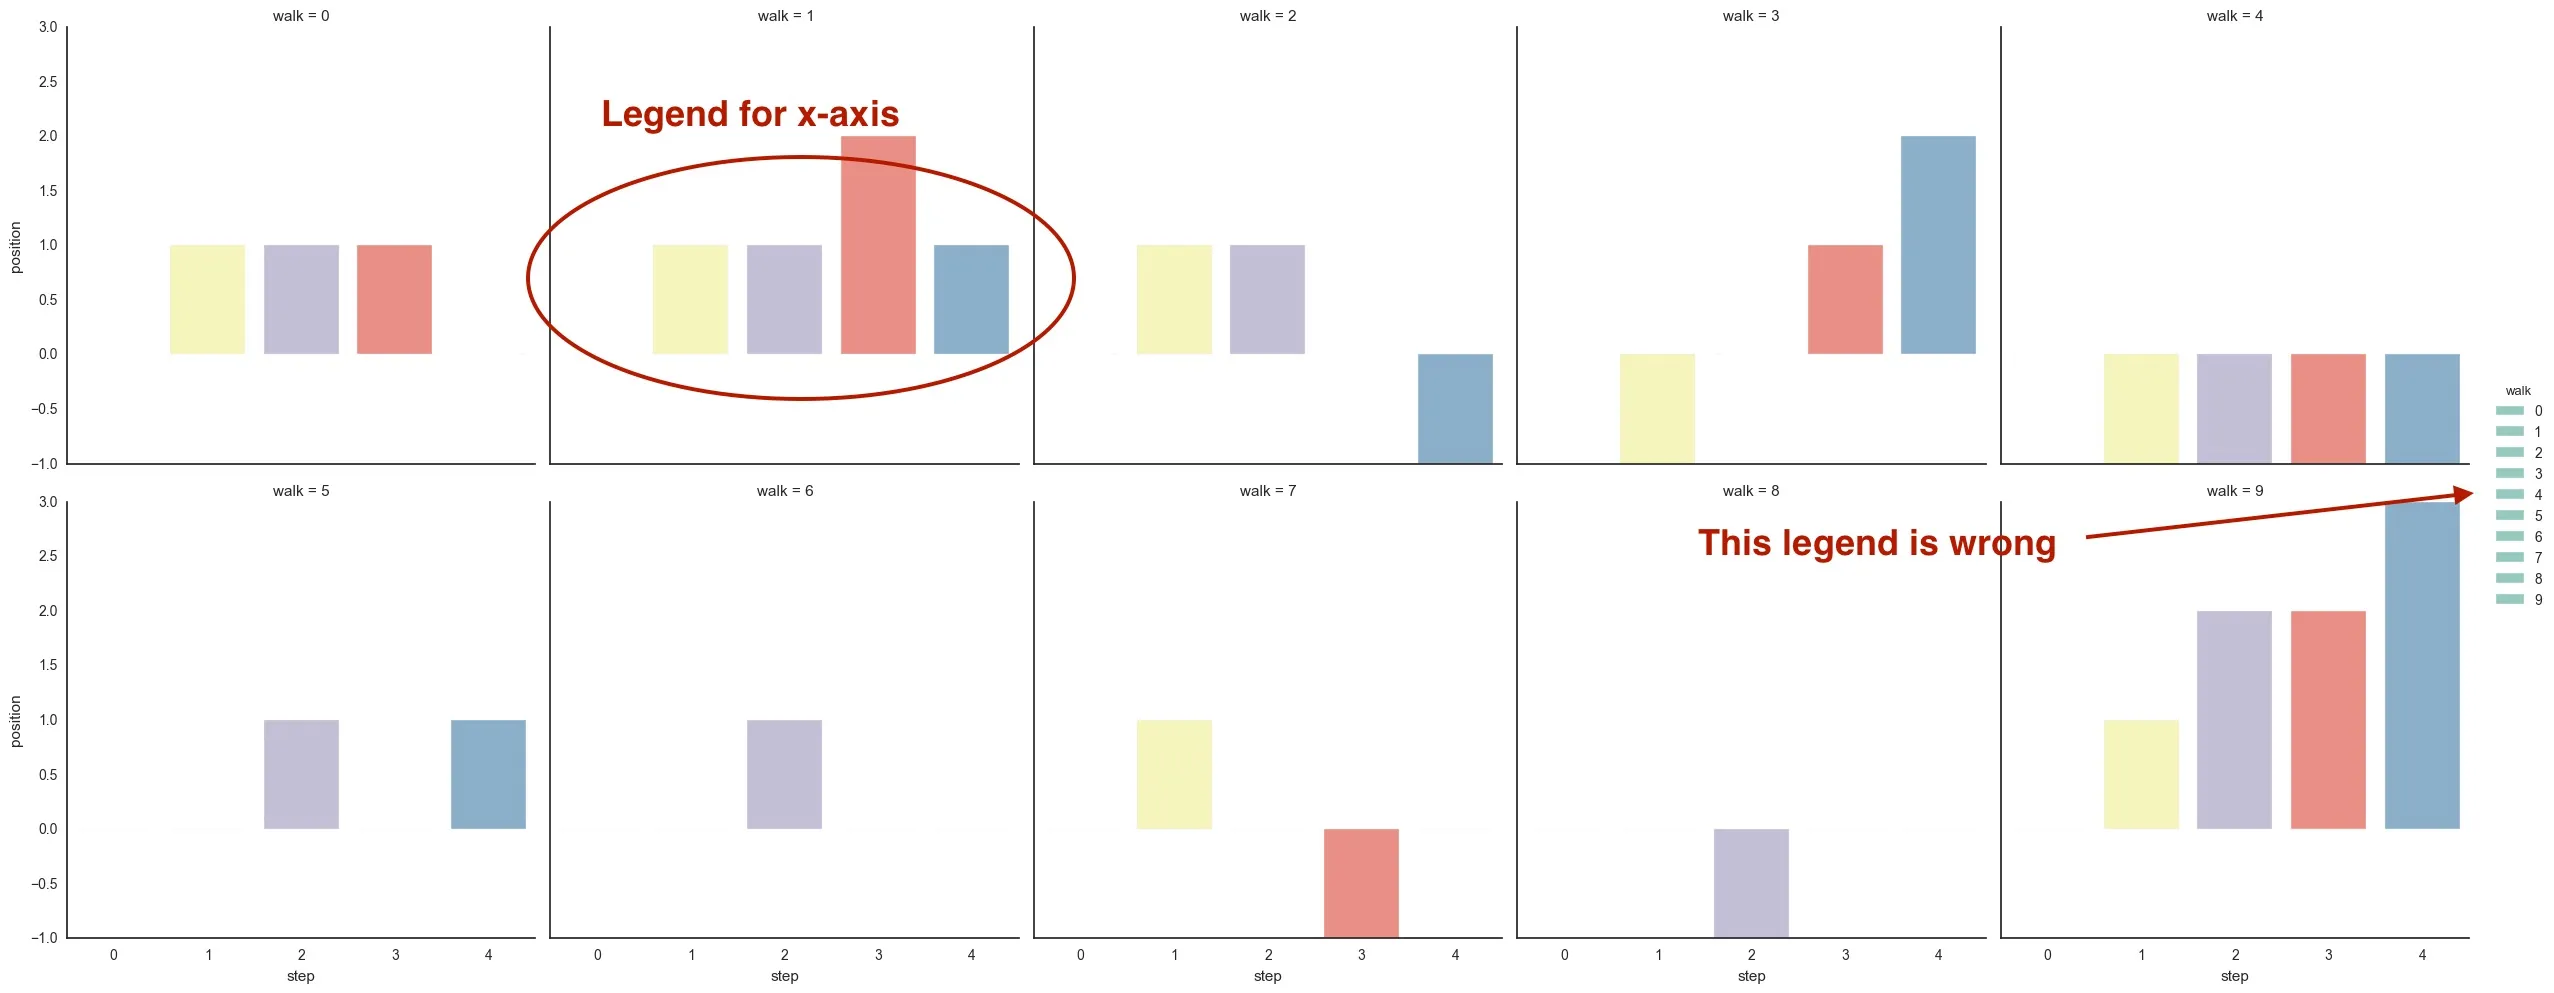
正如您所看到的,我把图例搞错了。该如何修正?
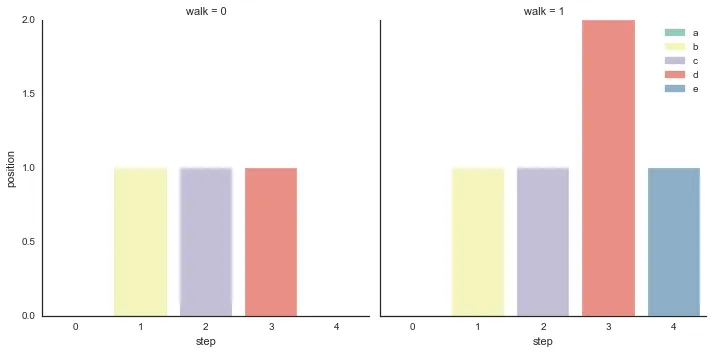

你应该使用 factorplot,或者如果你真的想直接使用 FacteGrid,你必须在 map 中传递 hue 变量。 - mwaskom
非常感谢@mwaskom。你能给个例子吗?我尝试了这个,但也失败了:grid.map(sns.barplot, "step", "position", hue="step", palette="Set3").add_legend(); - neversaint
这是第三个位置参数。但你真的应该使用 factorplot... - mwaskom
@mwaskom 抱歉,我的意思是我尝试了这个代码 grid = sns.factorplot(x="step",y="position", col="walk", kind="bar", data=df, col_wrap=4, aspect=1, size=5, palette="Set3").add_legend(),它可以运行但是图例没有出现。 - neversaint
2个回答

20

每个子图都有一个图例项。看起来,如果我们想让图例对应于每个子图中的条形图,我们必须手动创建它们。

# Let's just make a 1-by-2 plot
df = df.head(10)

# Initialize a grid of plots with an Axes for each walk
grid = sns.FacetGrid(df, col="walk", hue="walk", col_wrap=2, size=5,
        aspect=1)

# Draw a bar plot to show the trajectory of each random walk
bp = grid.map(sns.barplot, "step", "position", palette="Set3")

# The color cycles are going to all the same, doesn't matter which axes we use
Ax = bp.axes[0]

# Some how for a plot of 5 bars, there are 6 patches, what is the 6th one?
Boxes = [item for item in Ax.get_children()
         if isinstance(item, matplotlib.patches.Rectangle)][:-1]

# There is no labels, need to define the labels
legend_labels  = ['a', 'b', 'c', 'd', 'e']

# Create the legend patches
legend_patches = [matplotlib.patches.Patch(color=C, label=L) for
                  C, L in zip([item.get_facecolor() for item in Boxes],
                              legend_labels)]

# Plot the legend
plt.legend(handles=legend_patches)

enter image description here


a, b, c, d, e 来自哪里? 这不对应数据集中的任何内容。 - mwaskom
3
我只是凭想象编造的。这并没有在虚拟数据集中出现(或者仅仅是 [0, 1, 2, 3, 4],即x轴的值)。在真实数据集中,我猜测OP可能会给每个类别关联有意义的标签。 - CT Zhu
我认为 OP 希望图例标签是数据框 step 列中唯一的值。 - J Richard Snape

6
当你遇到传说无法解决的问题时,你可以轻松地自己创造一个,就像这样:
import matplotlib

name_to_color = {
    'Expected':   'green',
    'Provided':   'red',
    'Difference': 'blue',
}

patches = [matplotlib.patches.Patch(color=v, label=k) for k,v in name_to_color.items()]
matplotlib.pyplot.legend(handles=patches)

网页内容由stack overflow 提供, 点击上面的
可以查看英文原文,
原文链接