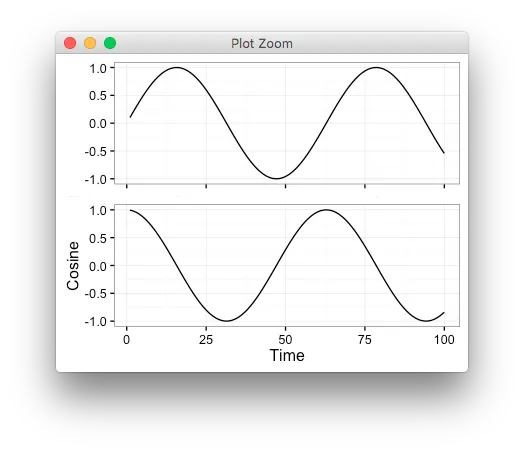
我有两组时间序列数据,想要以堆叠的方式绘制出来。目前我已经能够得到类似于这样的结果:
library(ggplot2);
library(gridExtra);

t=1:100; s=sin(t/10); c=cos(t/10);
g1=ggplot()+theme_bw()+geom_line(aes(x=t,y=s))+ylab(NULL)
g2=ggplot()+theme_bw()+geom_line(aes(x=t,y=c))+ylab("Cosine")+xlab("Time")

# get rid of the top plot's axis labels
g1=g1+theme(
  axis.text.x=element_blank(),
  panel.margin = unit(0,"null")
  );
g1=g1+labs(x=NULL);

# zero bottom margin of top plot
g1$theme$plot.margin[3]=unit(0,"null");

# zero top margin of bottom plot
g2$theme$plot.margin[1]=unit(0,"null");

# this trick equalizes the width of the two plot panels
g1g=ggplotGrob(g1);
g2g=ggplotGrob(g2);
g1g$widths=g2g$widths

# however, equalizing the heights of the panels is not so simple as
# the following:
# g1g$heights=g2g$heights

g=arrangeGrob(g1g,g2g)

plot(g)   #ggsave("out.svg",g,width=5,height=1.5);
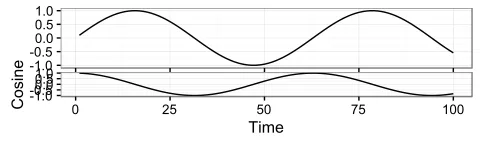
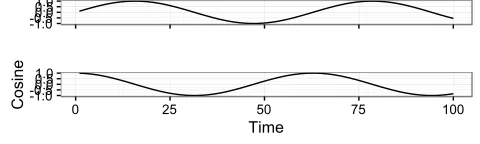
下面显示了合并的图。 我将其特别宽而短,以便您可以看到问题:
arrangeGrob使绘图高度相等,但这样做会使绘图面板具有不同的高度。 底部面板被底部绘图上的x轴标签和刻度标签挤压,而顶部绘图则没有。
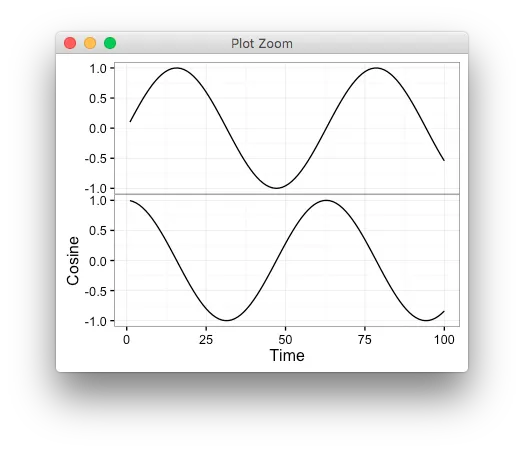
g1g$heights=g2g$heights
产生以下结果:
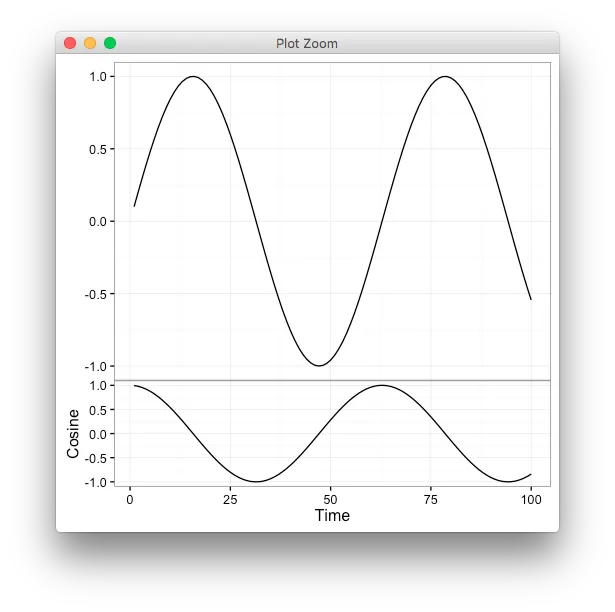
g=arrangeGrob(g1g,g2g,heights=c(1,2))
但是我必须调整数字直到看起来正确。
我想知道是否有一种简单的方法可以在最终渲染grobs时自动强制使两个面板具有相同的高度。