我正在尝试使用高斯曲线来拟合我的数据。以下是我的代码:
import numpy as np
from scipy import optimize

# The independent variable where the data is measured
x_coord = np.array([-0.1216    , -0.11692308, -0.11224615, -0.10756923, -0.10289231,
       -0.09821538, -0.09353846, -0.08886154, -0.08418462, -0.07950769,
       -0.07483077, -0.07015385, -0.06547692, -0.0608    , -0.05612308,
       -0.05144615, -0.04676923, -0.04209231, -0.03741538, -0.03273846,
       -0.02806154, -0.02338462, -0.01870769, -0.01403077, -0.00935385,
       -0.00467692,  0.        ,  0.00467692,  0.00935385,  0.01403077,
        0.01870769,  0.02338462,  0.02806154,  0.03273846,  0.03741538,
        0.04209231,  0.04676923,  0.05144615,  0.05612308,  0.0608    ,
        0.06547692,  0.07015385,  0.07483077,  0.07950769,  0.08418462,
        0.08886154,  0.09353846,  0.09821538,  0.10289231,  0.10756923,
        0.11224615,  0.11692308])

# The dependent data — nominally f(x_coord)
y = np.array([-0.0221931 , -0.02323915, -0.02414913, -0.0255389 , -0.02652465,
       -0.02888672, -0.03075954, -0.03355392, -0.03543005, -0.03839526,
       -0.040933  , -0.0456585 , -0.04849097, -0.05038776, -0.0466699 ,
       -0.04202133, -0.034239  , -0.02667525, -0.01404582, -0.00122683,
        0.01703862,  0.03992694,  0.06704549,  0.11362071,  0.28149172,
        0.6649422 ,  1.        ,  0.6649422 ,  0.28149172,  0.11362071,
        0.06704549,  0.03992694,  0.01703862, -0.00122683, -0.01404582,
       -0.02667525, -0.034239  , -0.04202133, -0.0466699 , -0.05038776,
       -0.04849097, -0.0456585 , -0.040933  , -0.03839526, -0.03543005,
       -0.03355392, -0.03075954, -0.02888672, -0.02652465, -0.0255389 ,
       -0.02414913, -0.02323915])

# define a gaussian function to fit the data
def gaussian(x, a, b, c):
    val = a * np.exp(-(x - b)**2 / c**2)
    return val

# fit the data
popt, pcov = optimize.curve_fit(gaussian, x_coord, y, sigma = np.array([0.01] * len(x_coord)))

# plot the data and the fitting curve
plt.plot(x_coord, y, 'b-', x_coord, gaussian(x_coord, popt[0], popt[1], popt[2]), 'r:')
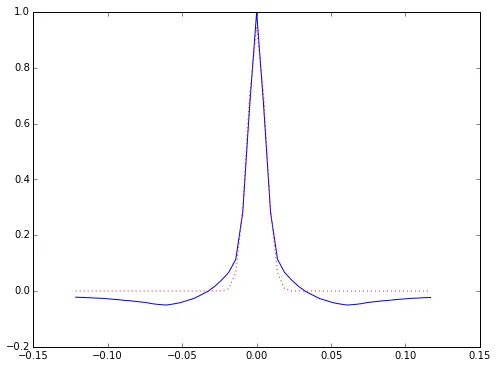
这张图显示拟合曲线完全错误:
我该怎么做才能获得好的拟合曲线?