我想使用 scipy.optimize.curve_fit 处理一些数据点,但是我遇到了不稳定的拟合,不知道原因。
import numpy as np
import matplotlib.pyplot as plt
from scipy.optimize import curve_fit
M = np.array([730,910,1066,1088,1150], dtype=float)
V = np.array([95.71581923, 146.18564513, 164.46723727, 288.49796413, 370.98703941], dtype=float)
def func(x, a, b, c):
return a * np.exp(b * x) + c
popt, pcov = curve_fit(func, M, V, [0,0,1], maxfev=100000000)
print(*popt)
fig, ax = plt.subplots()
fig.dpi = 80
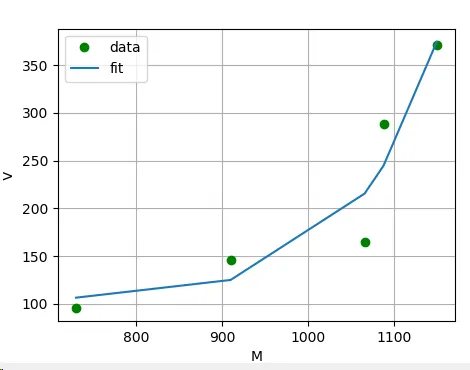
ax.plot(M, V, 'go', label='data')
ax.plot(M, func(M, *popt), '-', label='fit')
plt.xlabel("M")
plt.ylabel("V")
plt.grid()
plt.legend()
plt.show()
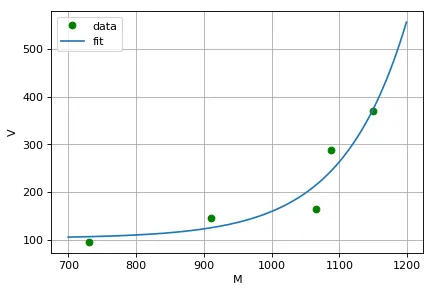
我本来期望看到一条平滑曲线。有人能解释一下我在这里做错了什么吗?