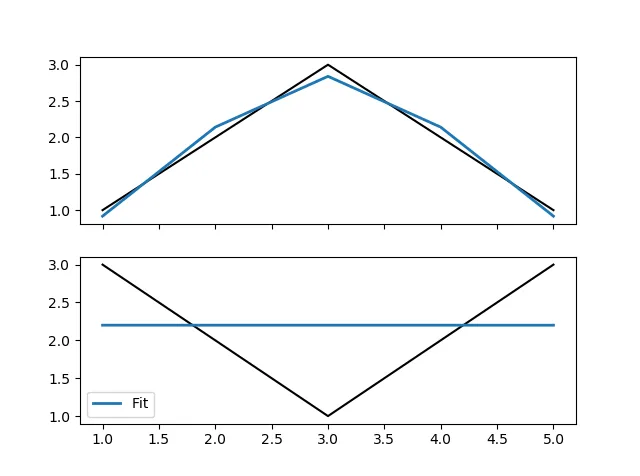
我正在尝试使用scipy.optimize.curve_fit来拟合一个反转的高斯分布线性。它可以完美地拟合传统的高斯分布,但无法拟合翻转符号的高斯分布,而是始终输出一条直线。
我还尝试通过限制高斯函数中的变量'a'始终为负来解决问题,但这并没有解决问题。指定-max(y)而不是max(y)似乎也没有帮助。
我还尝试通过限制高斯函数中的变量'a'始终为负来解决问题,但这并没有解决问题。指定-max(y)而不是max(y)似乎也没有帮助。
import scipy
import numpy as np
import matplotlib.pyplot as plt
import statsmodels.api as sm
from scipy import asarray as ar,exp

def fitdata(x, y):
    mean = sum(x * y) / sum(y)
    sigma = np.sqrt(sum(y * (x - mean) ** 2) / sum(y))

    def guassianfunc(xVar, a, b, c):
        return a * exp(-(xVar - b) ** 2 / (2 * c ** 2))

    popt, _ = scipy.optimize.curve_fit(guassianfunc, x, y, p0=[max(y), mean,         sigma])
    return guassianfunc(np.arange(1, 6, 1), *popt)


x = np.array((1,2,3,4,5))
f, ((ax1, ax2)) = plt.subplots(2, sharex='col', sharey='row')
y = np.array((1, 2, 3, 2, 1))
ax1.plot(x, y, color='black')
ax1.plot(x, fitdata(x, y), linewidth=2, label='Fit')
y = np.array((3, 2, 1, 2, 3))
ax2.plot(x, y, color='black')
ax2.plot(x, fitdata(x, y), linewidth=2, label='Fit')
plt.legend()