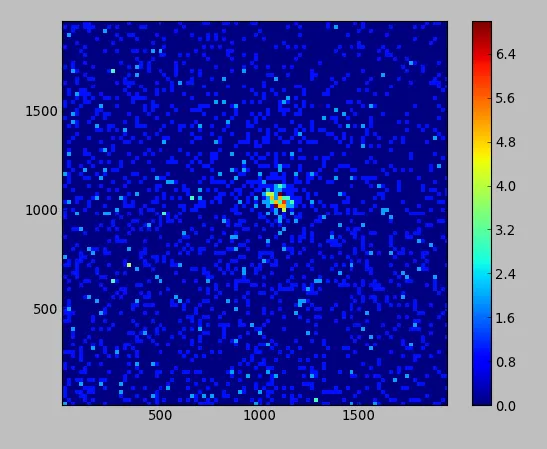
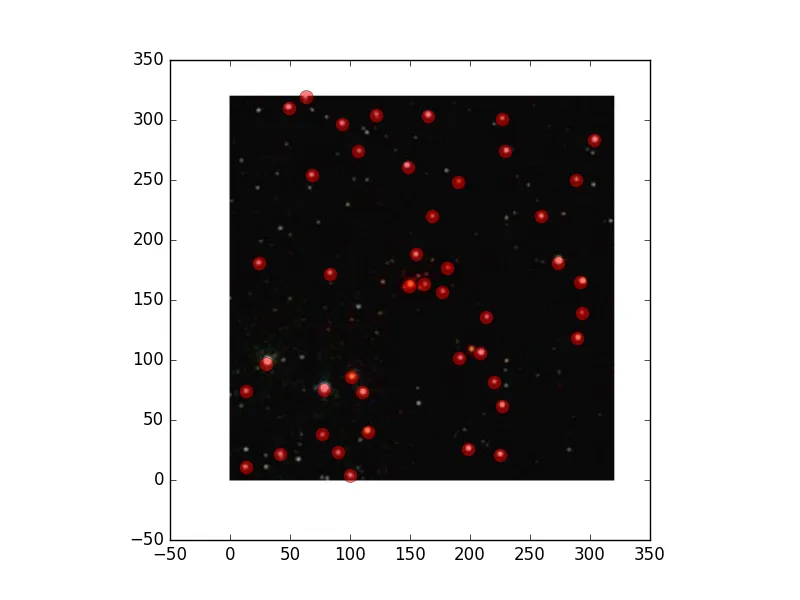
我试图让python返回一个图像中最明显聚类的中心点,并尽可能接近以下图片:
在我的先前的问题中,我问了如何获取2D数组的全局最大值和局部最大值,给出的答案完美解决了这个问题。问题是,我通过对不同bin size得到的全局最大值取平均值来获得的中心估计总是稍微偏离我会凭眼睛看出的那个中心点,因为我只考虑了最大的bin而没有考虑由多个最大的bin组成的group(就像用肉眼观察一样)。
我试着将这个问题的答案应用到我的问题上,但事实证明我的图像太嘈杂了,无法使用该算法。下面是我实现该答案的代码:
import numpy as np
from scipy.ndimage.filters import maximum_filter
from scipy.ndimage.morphology import generate_binary_structure, binary_erosion
import matplotlib.pyplot as pp

from os import getcwd
from os.path import join, realpath, dirname

# Save path to dir where this code exists.
mypath = realpath(join(getcwd(), dirname(__file__)))
myfile = 'data_file.dat'

x, y = np.loadtxt(join(mypath,myfile), usecols=(1, 2), unpack=True)
xmin, xmax = min(x), max(x)
ymin, ymax = min(y), max(y)

rang = [[xmin, xmax], [ymin, ymax]]
paws = []

for d_b in range(25, 110, 25):
    # Number of bins in x,y given the bin width 'd_b'
    binsxy = [int((xmax - xmin) / d_b), int((ymax - ymin) / d_b)]

    H, xedges, yedges = np.histogram2d(x, y, range=rang, bins=binsxy)
    paws.append(H)


def detect_peaks(image):
    """
    Takes an image and detect the peaks usingthe local maximum filter.
    Returns a boolean mask of the peaks (i.e. 1 when
    the pixel's value is the neighborhood maximum, 0 otherwise)
    """

    # define an 8-connected neighborhood
    neighborhood = generate_binary_structure(2,2)

    #apply the local maximum filter; all pixel of maximal value
    #in their neighborhood are set to 1
    local_max = maximum_filter(image, footprint=neighborhood)==image
    #local_max is a mask that contains the peaks we are
    #looking for, but also the background.
    #In order to isolate the peaks we must remove the background from the mask.

    #we create the mask of the background
    background = (image==0)

    #a little technicality: we must erode the background in order to
    #successfully subtract it form local_max, otherwise a line will
    #appear along the background border (artifact of the local maximum filter)
    eroded_background = binary_erosion(background, structure=neighborhood, border_value=1)

    #we obtain the final mask, containing only peaks,
    #by removing the background from the local_max mask
    detected_peaks = local_max - eroded_background

    return detected_peaks


#applying the detection and plotting results
for i, paw in enumerate(paws):
    detected_peaks = detect_peaks(paw)
    pp.subplot(4,2,(2*i+1))
    pp.imshow(paw)
    pp.subplot(4,2,(2*i+2) )
    pp.imshow(detected_peaks)

pp.show()
以下是通过更改组距所得到的结果:
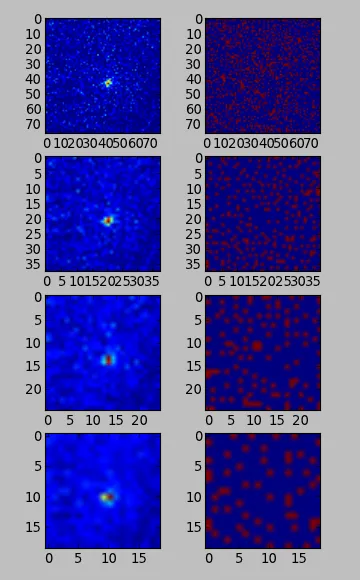
很明显,我的背景噪声太多了,使得该算法无法正常工作。因此,问题是:我如何使该算法变得更不敏感?如果存在另一种解决方案,请告诉我。
编辑
根据Bi Rico的建议,在将二维数组传递给局部最大值查找器之前,我尝试平滑化该数组,方法如下:
H, xedges, yedges = np.histogram2d(x, y, range=rang, bins=binsxy)
H1 = gaussian_filter(H, 2, mode='nearest')
paws.append(H1)
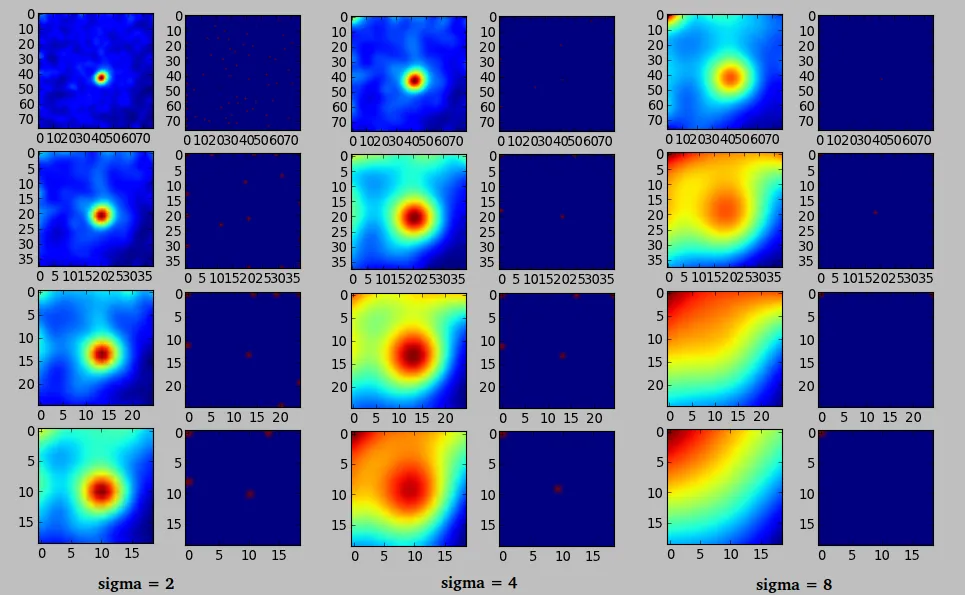
以下是当 sigma 值分别为 2、4 和 8 时的结果:
编辑 2
采用 mode ='constant' 要比 nearest 效果好得多。在最大 bin 大小为 sigma=2 时,它收敛到正确的中心位置:
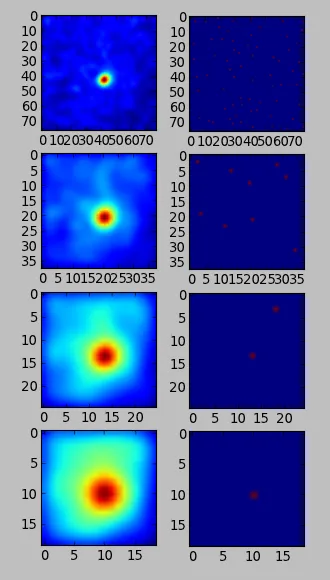
那么,我该如何获取出现在最后一张图片中的最大值的坐标?

np.unravel_index(array.argmax(), array.shape)? - Bi Rico