我制作了一张二维直方图,包含一些 (x, y) 数据,得到了如下图片:
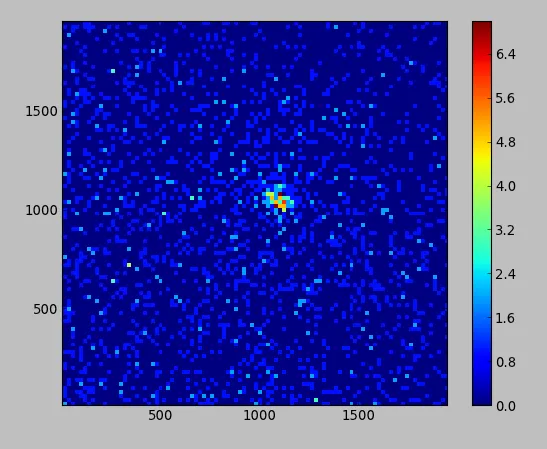
我想要一种方法来获取存储在 H 中最大值的点的 (x, y) 坐标。例如,在上面的图片中,这将是两个具有近似坐标的点:(1090, 1040) 和 (1110, 1090)。
以下是我的代码:
import numpy as np
import matplotlib.pyplot as plt
import matplotlib.cm as cm
from os import getcwd
from os.path import join, realpath, dirname

# Path to dir where this code exists.
mypath = realpath(join(getcwd(), dirname(__file__)))
myfile = 'datafile.dat'

x, y = np.loadtxt(join(mypath,myfile), usecols=(1, 2), unpack=True)

fig = plt.figure()
ax = fig.add_subplot(111)

xmin, xmax = min(x), max(x)
ymin, ymax = min(y), max(y)

rang = [[xmin, xmax], [ymin, ymax]]

binsxy = [int((xmax - xmin) / 20), int((ymax - ymin) / 20)]

H, xedges, yedges = np.histogram2d(x, y, range=rang, bins=binsxy)

extent = [yedges[0], yedges[-1], xedges[0], xedges[-1]]
cp = ax.imshow(H.transpose()[::-1], interpolation='nearest', extent=extent, cmap=cm.jet)
fig.colorbar(cp)

plt.show()
编辑
我已经尝试了Marek和Qarma发布的解决方案,试图获取箱子的坐标而不是它们的索引,如下所示:
# Marek's answer
x_cent, y_cent = unravel_index(H.argmax(), H.shape)
print('Marek')
print(x_cent, y_cent)
print(xedges[x_cent], yedges[y_cent])

# qarma's answer
idx = list(H.flatten()).index(H.max())
x_cent2, y_cent2 = idx / H.shape[1], idx % H.shape[1]
local_maxs = np.argwhere(H == H.max())
print('\nqarma')
print(x_cent2, y_cent2)
print(xedges[x_cent2], yedges[y_cent2])
print(xedges[local_maxs[0,0]], yedges[local_maxs[0,1]], xedges[local_maxs[1,0]], yedges[local_maxs[1,1]])
这将导致:
Marek
(53, 50)
(1072.7838144329899, 1005.0837113402063)

qarma
(53, 50)
(1072.7838144329899, 1005.0837113402063)
(1072.7838144329899, 1005.0837113402063, 1092.8257731958763, 1065.3611340206187)
所以最大坐标是一样的,这很好!现在我有一个小问题,因为当我放大2D图时,我发现全局最大值和局部最大值的坐标都有些偏移:
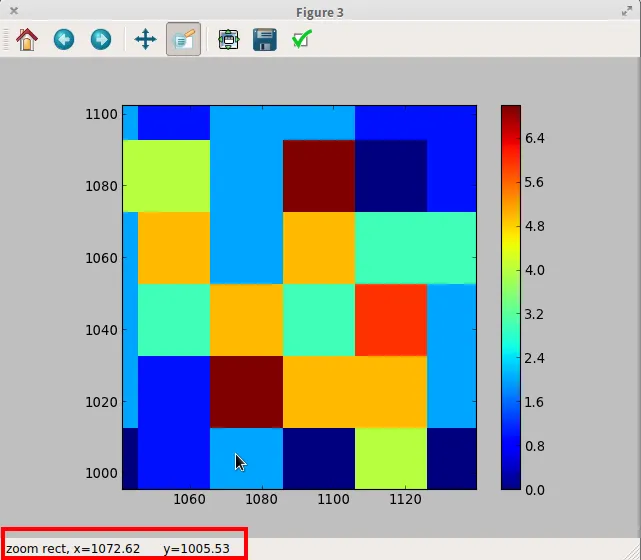
为什么会这样呢?