使用圆角区域边缘创建沃罗诺伊艺术

6
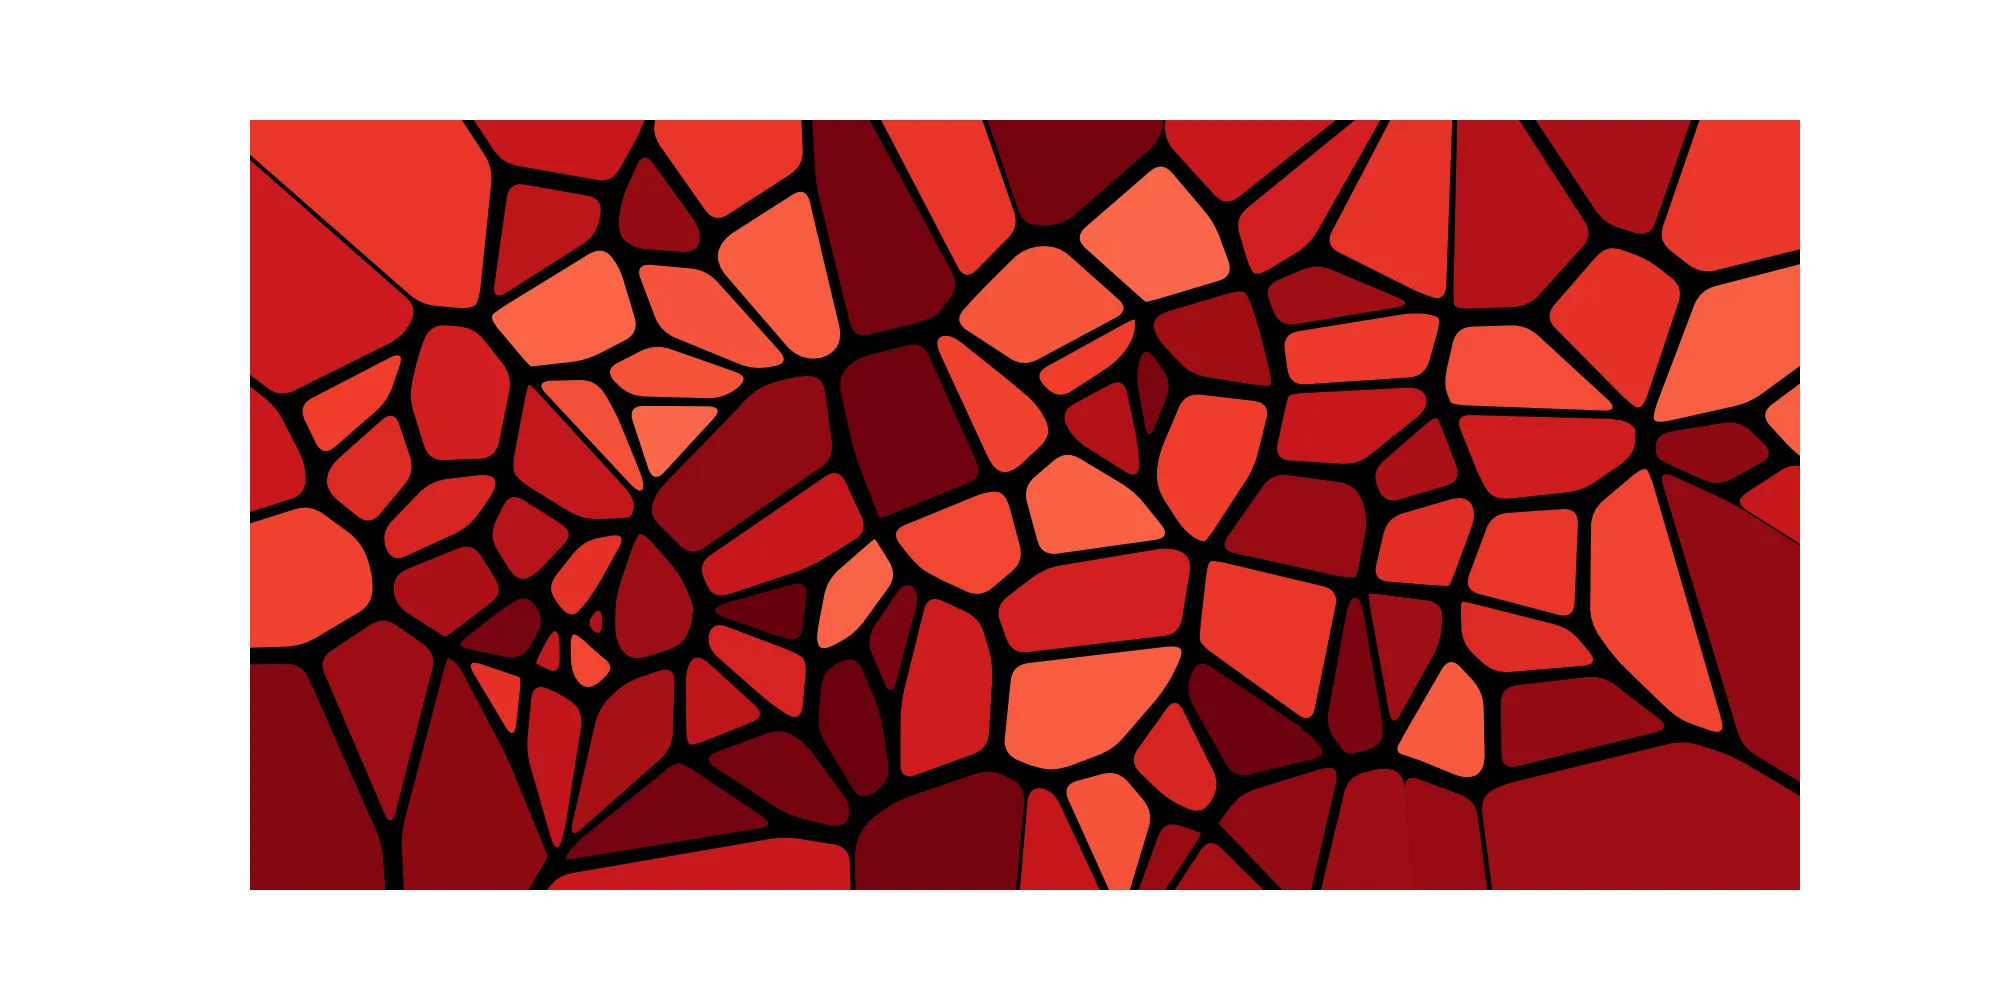
我正在尝试创建一些像下面这样的艺术“图形”:Red Voronoi artenter image description here
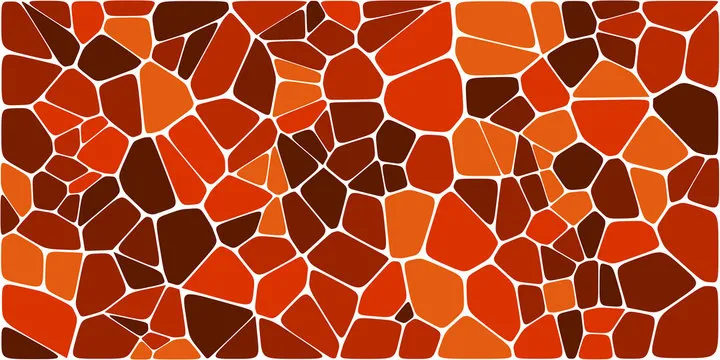
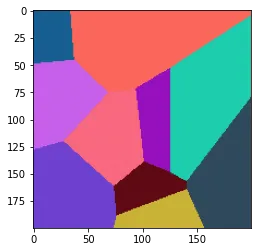
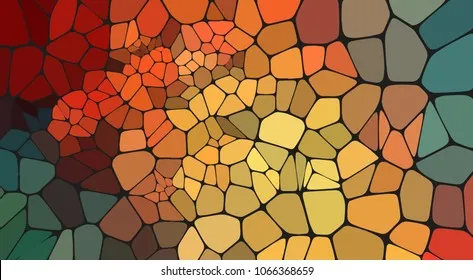
区域的颜色并不重要,我想实现的是沿着Voronoi区域的边缘的可变“厚度”(特别是它们在角落相遇时看起来像一个更大的圆形斑点,而在它们的中间点更薄)。我已经尝试通过手动“绘制”每个像素基于到每个质心的最小距离(每个关联一个颜色)来实现:
n_centroids = 10
centroids = [(random.randint(0, h), random.randint(0, w)) for _ in range(n_centroids)]
colors = np.array([np.random.choice(range(256), size=3) for _ in range(n_centroids)]) / 255

for x, y in it.product(range(h), range(w)):
    distances = np.sqrt([(x - c[0])**2 + (y - c[1])**2 for c in centroids])
    centroid_i = np.argmin(distances)
    img[x, y] = colors[centroid_i]
    
plt.imshow(img, cmap='gray')

voronoi diagram

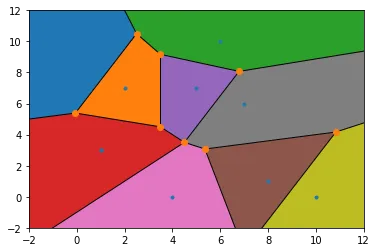
或者使用scipy.spatial.Voronoi,它也可以给我顶点的坐标,尽管我仍然不知道如何通过它们绘制具有所需变量厚度的线条。

from scipy.spatial import Voronoi, voronoi_plot_2d

# make up data points
points = [(random.randint(0, 10), random.randint(0, 10)) for _ in range(10)]

# add 4 distant dummy points
points = np.append(points, [[999,999], [-999,999], [999,-999], [-999,-999]], axis = 0)

# compute Voronoi tesselation
vor = Voronoi(points)

# plot
voronoi_plot_2d(vor)

# colorize
for region in vor.regions:
    if not -1 in region:
        polygon = [vor.vertices[i] for i in region]
        plt.fill(*zip(*polygon))

# fix the range of axes
plt.xlim([-2,12]), plt.ylim([-2,12])
plt.show()

voronoi region plot

编辑:

我通过对每个单独区域进行腐蚀和角点平滑(如评论中建议的中值滤波器)来得到了比较满意的结果,然后将其绘制在黑色背景上。

res = np.zeros((h,w,3))
for color in colors:
    region = (img == color)[:,:,0]
    region = region.astype(np.uint8) * 255
    region = sg.medfilt2d(region, 15) # smooth corners
    # make edges from eroding regions
    region = cv2.erode(region, np.ones((3, 3), np.uint8))
    region = region.astype(bool)
    res[region] = color
    
plt.imshow(res)

沃罗诺伊艺术 
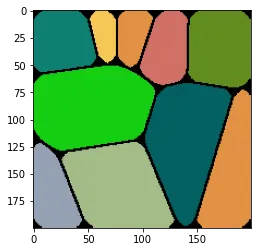
但是,正如您所看到的,在区域边界/边缘沿着“拉伸”的线条并不完整。还有其他建议吗?


1
对于 Voronoi 单元的每个角落,您可以定义绘制单元格的最大距离比实际距离缩短 x% 以达到 Voronoi 单元中心。 - Micka
2
另一种选择是将每个Voronoi单元表示为密集轮廓(单元边界的每个像素),并通过用其N个邻居的平均值替换每个轮廓点来执行轮廓平滑。这应该让单元在角落处收缩。然后在黑色背景上绘制单元。 - Micka
2
你可以尝试一下 radius in polygon edges - is it possible? 的第二个答案。 - JohanC
谢谢大家!我已经取得了一些进展和部分结果,但视觉吸引力还不够。我已经编辑了问题,添加了新的细节。 - rikyeah
是的!就像我之前写的那样,需要一些能够产生我正在努力编写的行类型的东西。 - rikyeah
显示剩余4条评论
2个回答

5
这是@JohanC建议的样子。在我看来,它比我的尝试使用Bezier曲线要好得多。然而,RoundedPolygon类似乎存在一个小问题,在角落处有时会出现小瑕疵(例如下面图像中蓝色和紫色之间)。
编辑:我修复了RoundedPolygon类。

enter image description here

#!/usr/bin/env python
# coding: utf-8
"""
https://dev59.com/YMTra4cB1Zd3GeqP2knt
"""

import numpy as np
import matplotlib.pyplot as plt

from matplotlib import patches, path
from scipy.spatial import Voronoi, voronoi_plot_2d


def shrink(polygon, pad):
    center = np.mean(polygon, axis=0)
    resized = np.zeros_like(polygon)
    for ii, point in enumerate(polygon):
        vector = point - center
        unit_vector = vector / np.linalg.norm(vector)
        resized[ii] = point - pad * unit_vector
    return resized


class RoundedPolygon(patches.PathPatch):
    # https://dev59.com/2XfZa4cB1Zd3GeqPV8Y2#66279687
    def __init__(self, xy, pad, **kwargs):
        p = path.Path(*self.__round(xy=xy, pad=pad))
        super().__init__(path=p, **kwargs)

    def __round(self, xy, pad):
        n = len(xy)

        for i in range(0, n):

            x0, x1, x2 = np.atleast_1d(xy[i - 1], xy[i], xy[(i + 1) % n])

            d01, d12 = x1 - x0, x2 - x1
            l01, l12 = np.linalg.norm(d01), np.linalg.norm(d12)
            u01, u12 = d01 / l01, d12 / l12

            x00 = x0 + min(pad, 0.5 * l01) * u01
            x01 = x1 - min(pad, 0.5 * l01) * u01
            x10 = x1 + min(pad, 0.5 * l12) * u12
            x11 = x2 - min(pad, 0.5 * l12) * u12

            if i == 0:
                verts = [x00, x01, x1, x10]
            else:
                verts += [x01, x1, x10]

        codes = [path.Path.MOVETO] + n*[path.Path.LINETO, path.Path.CURVE3, path.Path.CURVE3]

        verts[0] = verts[-1]

        return np.atleast_1d(verts, codes)


if __name__ == '__main__':

    # make up data points
    n = 100
    max_x = 20
    max_y = 10
    points = np.c_[np.random.uniform(0, max_x, size=n),
                   np.random.uniform(0, max_y, size=n)]

    # add 4 distant dummy points
    points = np.append(points, [[2 * max_x, 2 * max_y],
                                [   -max_x, 2 * max_y],
                                [2 * max_x,    -max_y],
                                [   -max_x,    -max_y]], axis = 0)

    # compute Voronoi tesselation
    vor = Voronoi(points)

    fig, ax = plt.subplots(figsize=(max_x, max_y))
    for region in vor.regions:
        if region and (not -1 in region):
            polygon = np.array([vor.vertices[i] for i in region])
            resized = shrink(polygon, 0.15)
            ax.add_patch(RoundedPolygon(resized, 0.2, color=plt.cm.Reds(0.5 + 0.5*np.random.rand())))

    ax.axis([0, max_x, 0, max_y])
    ax.axis('off')
    ax.set_facecolor('black')
    ax.add_artist(ax.patch)
    ax.patch.set_zorder(-1)
    plt.show()

3

贝塞尔多边形"近似"能否帮助我解决这个问题?

尝试使用贝塞尔曲线:

enter image description here

#!/usr/bin/env python
# coding: utf-8
"""
https://dev59.com/YMTra4cB1Zd3GeqP2knt
"""

import numpy as np
import matplotlib.pyplot as plt

from scipy.spatial import Voronoi, voronoi_plot_2d
from bezier.curve import Curve # https://bezier.readthedocs.io/en/stable/python/index.html


def get_bezier(polygon, n=10):
    closed_polygon = np.concatenate([polygon, [polygon[0]]])
    # Insert additional points lying along the edges of the polygon;
    # this allows us to use higher order bezier curves.
    augmented_polygon = np.array(augment(closed_polygon, n))
    # The bezier package does not seem to support closed bezier curves;
    # to simulate a closed bezier curve, we triplicate the polygon,
    # and only evaluate the curve on the inner third.
    triplicated_polygon = np.vstack([augmented_polygon, augmented_polygon, augmented_polygon])
    bezier_curve = Curve(triplicated_polygon.T, degree=len(triplicated_polygon)-1)
    return bezier_curve.evaluate_multi(np.linspace(1./3, 2./3, 100)).T


def augment(polygon, n=10):
    new_points = []
    for ii, (x0, y0) in enumerate(polygon[:-1]):
        x1, y1 = polygon[ii+1]
        x = np.linspace(x0, x1, n)
        y = np.linspace(y0, y1, n)
        new_points.extend(list(zip(x[:-1], y[:-1])))
    new_points.append((x1, y1))
    return new_points


if __name__ == '__main__':

    # make up data points
    points = np.random.randint(0, 11, size=(50, 2))

    # add 4 distant dummy points
    points = np.append(points, [[999,999], [-999,999], [999,-999], [-999,-999]], axis = 0)

    # compute Voronoi tesselation
    vor = Voronoi(points)
    # voronoi_plot_2d(vor)

    fig, ax = plt.subplots()
    for region in vor.regions:
        if region and (not -1 in region):
            polygon = np.array([vor.vertices[i] for i in region])
            bezier_curve_points = get_bezier(polygon, 40)
            ax.fill(*zip(*bezier_curve_points))

    ax.axis([1, 9, 1, 9])
    ax.axis('off')
    plt.show()

谢谢!看起来很不错!将n的值增加到40以上会留下一些空白的位置,可能是什么原因? - rikyeah
如果任意两点之间的距离太小,bezier.curve.Curve 有时会出现加密的错误消息。 - Paul Brodersen
这个答案更多是展示了使用贝塞尔曲线的效果(因为我最初也是想到了使用它们)。经过一番尝试,我认为@johanc提出的建议更好。 - Paul Brodersen

网页内容由stack overflow 提供, 点击上面的
可以查看英文原文,
原文链接