我正在matplotlib中绘制一个多边形。我输入了所有点的坐标。在某些点之间,我想要“圆”或“放射性”边缘而不是直线(比如在绘图中的1和2号点)。这是可能的吗?如果不行,最有效的绘制方法是什么?
编辑:Rutger的解决方案很好。
编辑:Rutger的解决方案很好。
import matplotlib.path as mpath
import matplotlib.patches as patches
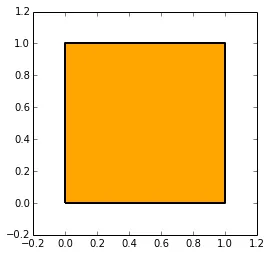
verts = [(0,0),
(1,0),
(1,1),
(0,1),
(0,0)]
codes = [mpath.Path.MOVETO] + (len(verts)-1)*[mpath.Path.LINETO]
square_verts = mpath.Path(verts, codes)
fig, ax = plt.subplots(subplot_kw={'aspect': 1.0, 'xlim': [-0.2,1.2], 'ylim': [-0.2,1.2]})
square = patches.PathPatch(square_verts, facecolor='orange', lw=2)
ax.add_patch(square)
可以使用以下方法创建圆角正方形:
verts = [(0.2, 0.0),
         (0.8, 0.0), # start of the lower right corner
         (1.0, 0.0), # intermediate point (as if it wasn't rounded)
         (1.0, 0.2), # end point of the lower right corner
         (1.0, 0.8), # move to the next point etc.
         (1.0, 1.0),
         (0.8, 1.0),
         (0.2, 1.0),
         (0.0, 1.0),
         (0.0, 0.8),
         (0.0, 0.2),
         (0.0, 0.0),
         (0.2, 0.0)]

codes = [mpath.Path.MOVETO,
         mpath.Path.LINETO,
         mpath.Path.CURVE3,
         mpath.Path.CURVE3,
         mpath.Path.LINETO,
         mpath.Path.CURVE3,
         mpath.Path.CURVE3,
         mpath.Path.LINETO,
         mpath.Path.CURVE3,
         mpath.Path.CURVE3,
         mpath.Path.LINETO,
         mpath.Path.CURVE3,
         mpath.Path.CURVE3]


rounded_verts = mpath.Path(verts, codes)

fig, ax = plt.subplots(subplot_kw={'aspect': 1.0, 'xlim': [-0.2,1.2], 'ylim': [-0.2,1.2]})

rounded_verts = patches.PathPatch(rounded_verts, facecolor='orange', lw=2)
ax.add_patch(rounded_verts)
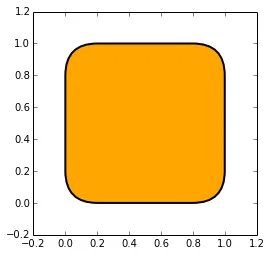
针对你的例子,你需要指定一个中间点,该中间点使用Point1的x坐标和Point2的y坐标。
Matplotlib路径教程提供了如何制作路径的详细说明:http://matplotlib.org/users/path_tutorial.html
此类适用于一般多边形。只需指定顶点和圆角的填充/半径即可。
import numpy as np
from matplotlib import patches, path, pyplot as plt


class RoundedPolygon(patches.PathPatch):
    def __init__(self, xy, pad, **kwargs):
        p = path.Path(*self.__round(xy=xy, pad=pad))
        super().__init__(path=p, **kwargs)

    def __round(self, xy, pad):
        n = len(xy)

        for i in range(0, n):

            x0, x1, x2 = np.atleast_1d(xy[i - 1], xy[i], xy[(i + 1) % n])

            d01, d12 = x1 - x0, x2 - x1
            d01, d12 = d01 / np.linalg.norm(d01), d12 / np.linalg.norm(d12)

            x00 = x0 + pad * d01
            x01 = x1 - pad * d01
            x10 = x1 + pad * d12
            x11 = x2 - pad * d12

            if i == 0:
                verts = [x00, x01, x1, x10]
            else:
                verts += [x01, x1, x10]
        codes = [path.Path.MOVETO] + n*[path.Path.LINETO, path.Path.CURVE3, path.Path.CURVE3]

        return np.atleast_1d(verts, codes)


# Test
xy = np.array([(0, 0), (0.25, 0), (0.5, -0.25), (0.75, 0),
               (1, 0), (1, 0.25), (1.25, 0.5), (1, 0.75),
               (1, 1), (0.75, 1), (0.5, 1.25), (0.25, 1),
               (0, 1), (0, 0.75), (-0.25, 0.5), (0, 0.25)])
rp = RoundedPolygon(xy=xy, pad=0.1, facecolor='red', edgecolor='magenta', lw=3)

fig, ax = plt.subplots()
ax.add_patch(rp)

ax.set_aspect(1)
ax.axis('off')
ax.set_xlim(-1, 2)
ax.set_ylim(-1, 2)
plt.savefig('star.png')

pad 大于向量 d01 和/或 d12 的长度(在转换为单位向量之前),则会出现错误。我已经在我的实现/适应性 这里 中修复了这个问题。 - Paul Brodersen