我正在尝试在有障碍物(多边形)的有界矩形空间中实现重心沃罗诺伊镶嵌算法。
以下代码在没有障碍物(多边形)的边界框中提供了重心沃罗诺伊镶嵌图。蓝点是发生器,红点是重心,黄点是蓝点和红点之间的中间点。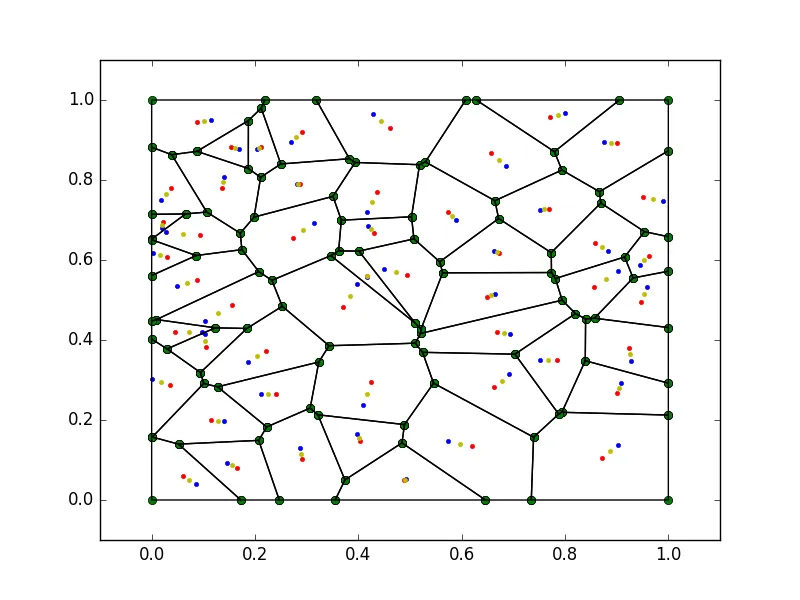
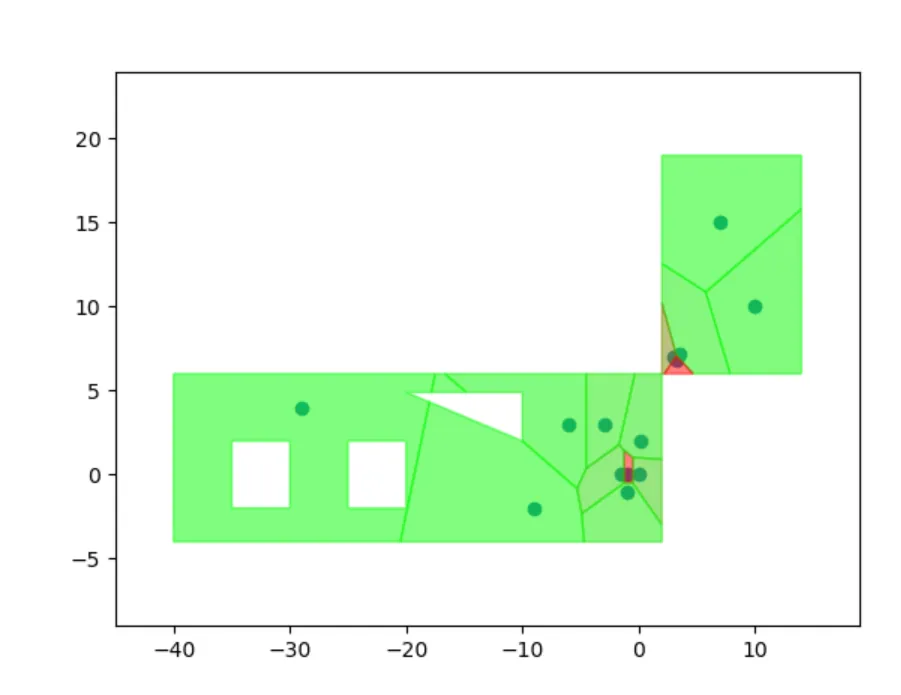
现在我想将这个特定的代码扩展到有障碍物的情况,例如我想做类似于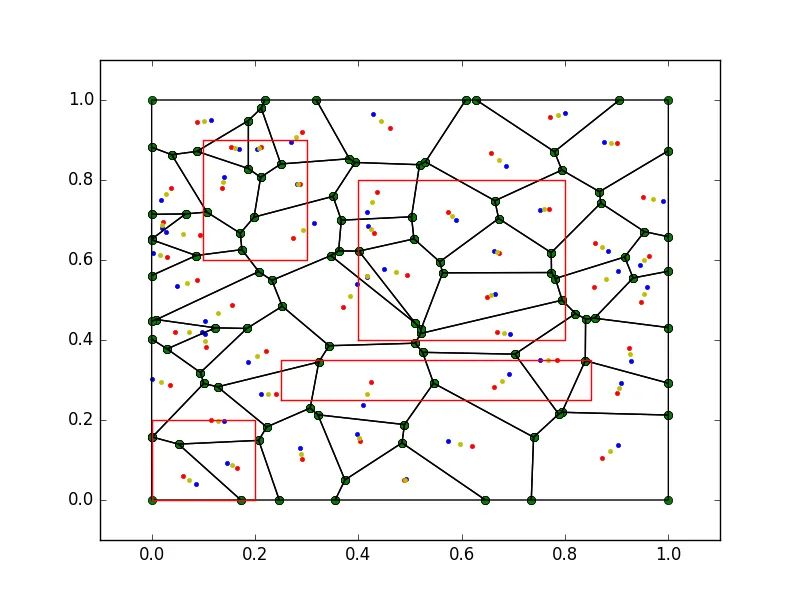 ,但是我不想有任何红色多边形中的内容。
我尝试过的一种方法是使用未占用区域划分空间,但效果不佳。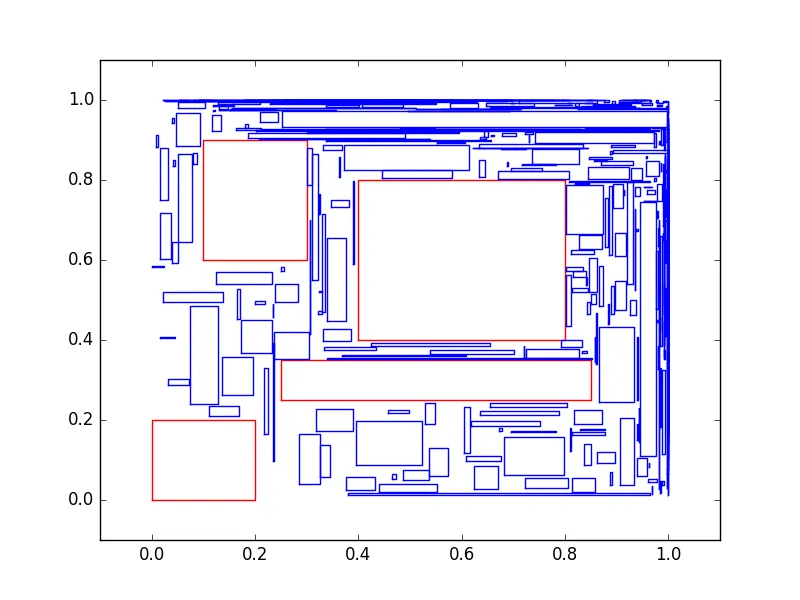 。
。
第一种方法的代码:
以下代码在没有障碍物(多边形)的边界框中提供了重心沃罗诺伊镶嵌图。蓝点是发生器,红点是重心,黄点是蓝点和红点之间的中间点。
import matplotlib.pyplot as pl
import numpy as np
import scipy as sp
import scipy.spatial
import sys


np.random.seed(1)
eps = sys.float_info.epsilon

n_robots = 10
robots = np.random.rand(n_robots, 2)
#print(robots)
bounding_box = np.array([0., 1., 0., 1.])

def in_box(robots, bounding_box):
    return np.logical_and(np.logical_and(bounding_box[0] <= robots[:, 0],
                                         robots[:, 0] <= bounding_box[1]),
                          np.logical_and(bounding_box[2] <= robots[:, 1],
                                         robots[:, 1] <= bounding_box[3]))


def voronoi(robots, bounding_box):
    i = in_box(robots, bounding_box)
    points_center = robots[i, :]
    points_left = np.copy(points_center)
    points_left[:, 0] = bounding_box[0] - (points_left[:, 0] - bounding_box[0])
    points_right = np.copy(points_center)
    points_right[:, 0] = bounding_box[1] + (bounding_box[1] - points_right[:, 0])
    points_down = np.copy(points_center)
    points_down[:, 1] = bounding_box[2] - (points_down[:, 1] - bounding_box[2])
    points_up = np.copy(points_center)
    points_up[:, 1] = bounding_box[3] + (bounding_box[3] - points_up[:, 1])
    points = np.append(points_center,
                       np.append(np.append(points_left,
                                           points_right,
                                           axis=0),
                                 np.append(points_down,
                                           points_up,
                                           axis=0),
                                 axis=0),
                       axis=0)
# Compute Voronoi
    vor = sp.spatial.Voronoi(points)
    # Filter regions and select corresponding points
    regions = []
    points_to_filter = [] # we'll need to gather points too
    ind = np.arange(points.shape[0])
    ind = np.expand_dims(ind,axis= 1)

    for i,region in enumerate(vor.regions): # enumerate the regions
        if not region: # nicer to skip the empty region altogether
            continue

        flag = True
        for index in region:
            if index == -1:
                flag = False
                break
            else:
                x = vor.vertices[index, 0]
                y = vor.vertices[index, 1]
                if not(bounding_box[0] - eps <= x and x <= bounding_box[1] + eps and
                      bounding_box[2] - eps <= y and y <= bounding_box[3] + eps):
                    flag = False
                    break
        if flag:
            regions.append(region)

           # find the point which lies inside
            points_to_filter.append(vor.points[vor.point_region == i][0,:])

    vor.filtered_points = np.array(points_to_filter)
    vor.filtered_regions = regions
    return vor

def centroid_region(vertices):

    A = 0

    C_x = 0

    C_y = 0
    for i in range(0, len(vertices) - 1):
        s = (vertices[i, 0] * vertices[i + 1, 1] - vertices[i + 1, 0] * vertices[i, 1])
        A = A + s
        C_x = C_x + (vertices[i, 0] + vertices[i + 1, 0]) * s
        C_y = C_y + (vertices[i, 1] + vertices[i + 1, 1]) * s
    A = 0.5 * A
    C_x = (1.0 / (6.0 * A)) * C_x
    C_y = (1.0 / (6.0 * A)) * C_y
    return np.array([[C_x, C_y]])

def plot(r,index):
    vor = voronoi(r, bounding_box)

    fig = pl.figure()
    ax = fig.gca()
    #ax.plot(pol2[:,0],pol2[:,1],'k-')
# Plot initial points
    ax.plot(vor.filtered_points[:, 0], vor.filtered_points[:, 1], 'b.')
    print("initial",vor.filtered_points)
# Plot ridges points
    for region in vor.filtered_regions:
        vertices = vor.vertices[region, :]
        ax.plot(vertices[:, 0], vertices[:, 1], 'go')
# Plot ridges
    for region in vor.filtered_regions:
        vertices = vor.vertices[region + [region[0]], :]
        ax.plot(vertices[:, 0], vertices[:, 1], 'k-')
# Compute and plot centroids
    centroids = []
    for region in vor.filtered_regions:
        vertices = vor.vertices[region + [region[0]], :]
        centroid = centroid_region(vertices)
        centroids.append(list(centroid[0, :]))
        ax.plot(centroid[:, 0], centroid[:, 1], 'r.')
    centroids = np.asarray(centroids)
    rob = np.copy(vor.filtered_points)
    # the below code is for the plotting purpose the update happens in the update function
    interim_x = np.asarray(centroids[:,0] - rob[:,0])
    interim_y = np.asarray(centroids[:,1] - rob[:,1])
    magn = [np.linalg.norm(centroids[i,:] - rob[i,:]) for i in range(rob.shape[0])]
    x = np.copy(interim_x)
    x = np.asarray([interim_x[i]/magn[i] for i in range(interim_x.shape[0])])
    y = np.copy(interim_y)
    y = np.asarray([interim_y[i]/magn[i] for i in range(interim_y.shape[0])])
    nor = np.copy(rob)
    for i in range(x.shape[0]):
        nor[i,0] = x[i]
        nor[i,1] = y[i]
    temp = np.copy(rob)
    temp[:,0] = [rob[i,0] + 0.5*interim_x[i] for i in range(rob.shape[0])]
    temp[:,1] = [rob[i,1] + 0.5*interim_y[i] for i in range(rob.shape[0])]
    pol = [[]]
    ax.plot(temp[:,0] ,temp[:,1], 'y.' )
    ax.set_xlim([-0.1, 1.1])
    ax.set_ylim([-0.1, 1.1])
    pl.savefig("voronoi" + str(index) + ".png")
    return centroids

def update(rob,centroids):

  interim_x = np.asarray(centroids[:,0] - rob[:,0])
  interim_y = np.asarray(centroids[:,1] - rob[:,1])
  magn = [np.linalg.norm(centroids[i,:] - rob[i,:]) for i in range(rob.shape[0])]
  x = np.copy(interim_x)
  x = np.asarray([interim_x[i]/magn[i] for i in range(interim_x.shape[0])])
  y = np.copy(interim_y)
  y = np.asarray([interim_y[i]/magn[i] for i in range(interim_y.shape[0])])
  nor = [np.linalg.norm([x[i],y[i]]) for i in range(x.shape[0])]
  temp = np.copy(rob)
  temp[:,0] = [rob[i,0] + 0.5*interim_x[i] for i in range(rob.shape[0])]
  temp[:,1] = [rob[i,1] + 0.5*interim_y[i] for i in range(rob.shape[0])]
  return np.asarray(temp)

if __name__ == '__main__':
    for i in range(1):
        centroids = plot(robots,i)
        robots = update(robots,centroids)
现在我想将这个特定的代码扩展到有障碍物的情况,例如我想做类似于
,但是我不想有任何红色多边形中的内容。我尝试过的一种方法是使用未占用区域划分空间,但效果不佳。
。第一种方法的代码:
import random
from shapely.geometry import Polygon, Point
import numpy as np
import matplotlib.pyplot as pl

def get_random_point_in_polygon(poly,polygons,num):
     (minx, miny, maxx, maxy) = poly.bounds
     points =[]
     while num != 0:
         p = Point(random.uniform(minx, maxx), random.uniform(miny, maxy))
         if any(poly.contains(p) for poly in polygons):
             continue
         else:
            num = num-1
            #print(num)
            points.append([p.x,p.y])
     return np.asarray(points)

def polysplit(poly,polygons):
     (minx, miny, maxx, maxy) = poly.bounds
     pols =[]

     return pols

def randomRects(p,poly):
    (minx, miny, maxx, maxy) = poly.bounds
    rect = []
    while True:
        w = round(random.uniform(0, 1),3)
        h = round(random.uniform(0, 1),3)

        if (((p[:,0]+w) < maxx) and ((p[:,1]+h) < maxy)):
            rect.append(np.squeeze([np.squeeze(p[:,0]),np.squeeze(p[:,1])]))
            rect.append(np.squeeze([np.squeeze(p[:,0]+w),np.squeeze(p[:,1])]))
            rect.append(np.squeeze([np.squeeze(p[:,0]+w),np.squeeze(p[:,1]+h)]))
            rect.append(np.squeeze([np.squeeze(p[:,0]),np.squeeze(p[:,1]+h)]))
            rect.append(np.squeeze([np.squeeze(p[:,0]),np.squeeze(p[:,1])]))


            break
        else:
            continue
    return np.asarray(rect)


def rect(poly,polygons):
    rec =[]
    area = poly.area
    areas = 0
    for i in polygons:
        areas = areas+i.area
    #print(area - areas)
    flag = False
    while (area - areas) > 0.4:
        p = get_random_point_in_polygon(poly,polygons,1)
        #print(p)
        rect = randomRects(p,poly)
        if any(poly.intersects(Polygon(rect)) for poly in polygons):

            continue
        #elif any(poly.intersects(Polygon(rect)) for poly in rec):
            #continue
        else:
            if rec == []:
                rec.append(Polygon(rect))
                print("hi")
            elif any(pol.intersects(Polygon(rect)) for pol in rec):
                continue
            else:
                areas = areas+Polygon(rect).area
                print(area-areas)
                rec.append(Polygon(rect))
    return rec
p = Polygon([(0, 0), (1, 0), (1, 1), (0, 1), (0, 0)])
p2 = Polygon([(0, 0), (.2,0), (.2,.2), (0, 0.2), (0,0)])
p3 = Polygon([(0.4, 0.4), (0.8,0.4), (.8,.8), (0.4, 0.8), (0.4,0.4)])
p4 = Polygon([(0.1,0.6),(0.3,.6),(0.3,0.9),(0.1,0.9),(0.1,0.6)])
p5 = Polygon([(0.25,0.25),(0.85,.25),(0.85,0.35),(0.25,0.35),(0.25,0.25)])
polygons = []
polygons.append(p2)
polygons.append(p3)
polygons.append(p4)
polygons.append(p5)
point_in_poly = get_random_point_in_polygon(p,polygons,10000)
fig = pl.figure()
ax = fig.gca()
#ax.plot(point_in_poly[:,0],point_in_poly[:,1],'b.')
area = 0
for po in polygons:
    #area = area +po.area

    x,y = po.exterior.xy
    #print [x,y]
    ax.plot(x,y,'r-')
#print(p.area - area)
r = rect(p,polygons)
for rr in r:
    #area = area +po.area

    x,y = rr.exterior.xy
    #print [x,y]
    ax.plot(x,y,'b-')


ax.set_xlim([-0.1, 1.1])
ax.set_ylim([-0.1, 1.1])
pl.savefig("test1.png")
第二种方法是我考虑使用二进制空间分割来将自由区域划分为矩形,并对每个自由区域矩形应用上述代码。但我不确定如何在Python中实现。
第三种方法:我使用了Python的triangle库来计算自由空间的符合约束的Delaunay三角剖分,并尝试将其转换回Voronoi图。结果并不如预期。
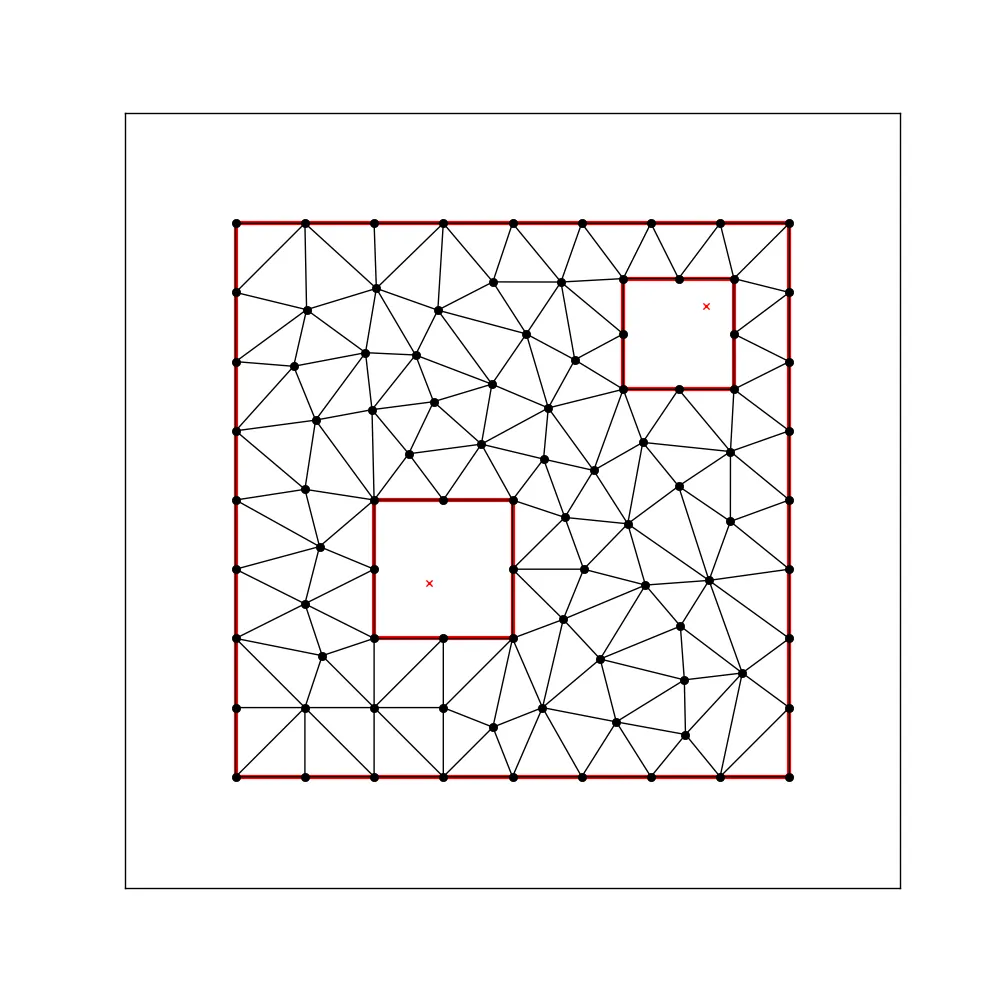 以及它的
以及它的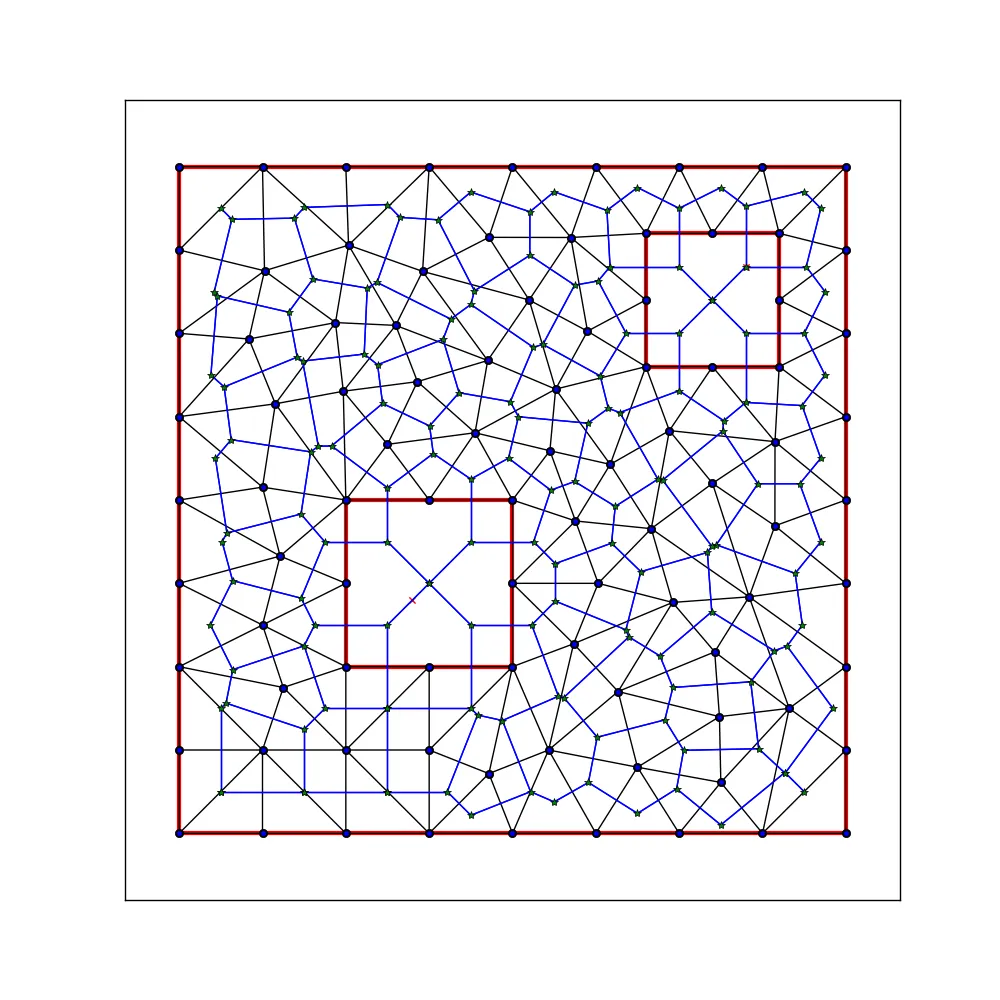
下面的代码是我尝试的所有方法的编译,所以可能有点凌乱。我尝试使用Scipy、Triangle库中的Voronoi函数,并尝试使用自定义方法将三角剖分转换为Voronoi。但这些代码不太好用,而且还存在一些错误。
from numpy import array
import numpy as np


def read_poly(file_name):
    """
    Simple poly-file reader, that creates a python dictionary
    with information about vertices, edges and holes.
    It assumes that vertices have no attributes or boundary markers.
    It assumes that edges have no boundary markers.
    No regional attributes or area constraints are parsed.
    """

    output = {'vertices': None, 'holes': None, 'segments': None}

    # open file and store lines in a list
    file = open(file_name, 'r')
    lines = file.readlines()
    file.close()
    lines = [x.strip('\n').split() for x in lines]

    # Store vertices
    vertices= []
    N_vertices, dimension, attr, bdry_markers = [int(x) for x in lines[0]]
    # We assume attr = bdrt_markers = 0
    for k in range(N_vertices):
        label, x, y = [items for items in lines[k+1]]
        vertices.append([float(x), float(y)])
    output['vertices']=array(vertices)

    # Store segments
    segments = []
    N_segments, bdry_markers = [int(x) for x in lines[N_vertices+1]]
    for k in range(N_segments):
        label, pointer_1, pointer_2 = [items for items in lines[N_vertices+k+2]]
        segments.append([int(pointer_1)-1, int(pointer_2)-1])
    output['segments'] = array(segments)

    # Store holes
    N_holes = int(lines[N_segments+N_vertices+2][0])
    holes = []
    for k in range(N_holes):
        label, x, y = [items for items in lines[N_segments + N_vertices + 3 + k]]
        holes.append([float(x), float(y)])

    output['holes'] = array(holes)
    print(holes)

    return output


from triangle import triangulate,voronoi, plot as tplot
import matplotlib.pyplot as plt
image = read_poly("/home/pranav/catkin_ws/src/beginner_tutorials/scripts/test.poly")
cncfq20adt = triangulate(image, 'pq20a.01D')
#print(cncfq20adt['vertices'])
#print(cncfq20adt['triangles'])
plt.figure(figsize=(10, 10))
ax = plt.subplot(111, aspect='equal')
tplot.plot(ax, **cncfq20adt)
plt.savefig("image.png")


import triangle
from scipy.spatial import Delaunay

pts = cncfq20adt['vertices']
tri = Delaunay(pts)
p = tri.points[tri.vertices]

#print(pts)
# Triangle vertices
A = p[:,0,:].T
B = p[:,1,:].T
C = p[:,2,:].T
print(C)
# See http://en.wikipedia.org/wiki/Circumscribed_circle#Circumscribed_circles_of_triangles
# The following is just a direct transcription of the formula there
a = A - C
b = B - C

def dot2(u, v):
    return u[0]*v[0] + u[1]*v[1]

def cross2(u, v, w):
    """u x (v x w)"""
    return dot2(u, w)*v - dot2(u, v)*w

def ncross2(u, v):
    """|| u x v ||^2"""
    return sq2(u)*sq2(v) - dot2(u, v)**2

def sq2(u):
    return dot2(u, u)

cc = cross2(sq2(a) * b - sq2(b) * a, a, b) / (2*ncross2(a, b)) + C

# Grab the Voronoi edges
vc = cc[:,tri.neighbors]
vc[:,tri.neighbors == -1] = np.nan # edges at infinity, plotting those would need more work...

lines = []
lines.extend(zip(cc.T, vc[:,:,0].T))
lines.extend(zip(cc.T, vc[:,:,1].T))
lines.extend(zip(cc.T, vc[:,:,2].T))

# Plot it
import matplotlib.pyplot as plt
from matplotlib.collections import LineCollection

lines = LineCollection(lines, edgecolor='b')

#plt.hold(1)
plt.plot(pts[:,0], pts[:,1], '.')
plt.plot(cc[0], cc[1], '*')
plt.gca().add_collection(lines)
plt.axis('equal')
plt.xlim(-0.1, 1.1)
plt.ylim(-0.1, 1.1)
plt.savefig("vor2.png")
ax1 = plt.subplot(121, aspect='equal')
triangle.plot.plot(ax1, vertices=pts)
lim = ax1.axis()

points, edges, ray_origin, ray_direct = triangle.voronoi(pts)
d = dict(vertices=points, edges=edges, ray_origins=ray_origin, ray_directions=ray_direct)
ax2 = plt.subplot(111, aspect='equal')
triangle.plot.plot(ax2, **d)
ax2.axis(lim)

plt.savefig("vor.png")


import matplotlib.pyplot as pl

import scipy as sp
import scipy.spatial
import sys
from shapely.geometry import Polygon,Point
import random
np.random.seed(1)
eps = sys.float_info.epsilon
"""
n_robots = 50
#robots = np.random.rand(n_robots, 2)

def get_random_point_in_polygon(poly,polygons,num):
     (minx, miny, maxx, maxy) = poly.bounds
     points =[]
     while num != 0:
         p = Point(random.uniform(minx, maxx), random.uniform(miny, maxy))
         if any(poly.contains(p) for poly in polygons):
             continue
         else:
          num = num-1
          print(num)
          points.append([p.x,p.y])
     return np.asarray(points)

def polysplit(poly,polygons):
    rectangles = []

    return rectangles
p = Polygon([(0, 0), (1, 0), (1, 1), (0, 1), (0, 0)])
p2 = Polygon([(0, 0), (.2,0), (.2,.2), (0, 0.2), (0,0)])
p3 = Polygon([(0.4, 0.4), (0.7,0.4), (.7,.7), (0.4, 0.7), (0.4,0.4)])
polygons = []
polygons.append(p2)
polygons.append(p3)
#point_in_poly = get_random_point_in_polygon(p,polygons,10)
robots = get_random_point_in_polygon(p,polygons,n_robots)

#print(sampl)
print(robots)
bounding_box = np.array([0., 1, 0., 1])
box = np.array([0.2, 0.6, 0, 0.6])
box2 = np.array([0, 0.6, 0.2, 0.6])
boxes =[]
boxes.append(box)
boxes.append(box2)
"""
robots = cncfq20adt['vertices']
print("length",len(robots))
bounding_box = np.array([0., 1., 0., 1.])

def in_box(robots, bounding_box):
    return np.logical_and(np.logical_and(bounding_box[0] <= robots[:, 0],
                                         robots[:, 0] <= bounding_box[1]),
                          np.logical_and(bounding_box[2] <= robots[:, 1],
                                         robots[:, 1] <= bounding_box[3]))


def voronoi(robots, bounding_box):
    i = in_box(robots, bounding_box)
    points_center = robots[i, :]
    points_left = np.copy(points_center)
    points_left[:, 0] = bounding_box[0] - (points_left[:, 0] - bounding_box[0])
    points_right = np.copy(points_center)
    points_right[:, 0] = bounding_box[1] + (bounding_box[1] - points_right[:, 0])
    points_down = np.copy(points_center)
    points_down[:, 1] = bounding_box[2] - (points_down[:, 1] - bounding_box[2])
    points_up = np.copy(points_center)
    points_up[:, 1] = bounding_box[3] + (bounding_box[3] - points_up[:, 1])
    points = np.append(points_center,
                       np.append(np.append(points_left,
                                           points_right,
                                           axis=0),
                                 np.append(points_down,
                                           points_up,
                                           axis=0),
                                 axis=0),
                       axis=0)
# Compute Voronoi
    vor = sp.spatial.Voronoi(points)
    # Filter regions and select corresponding points
    regions = []
    points_to_filter = [] # we'll need to gather points too
    ind = np.arange(points.shape[0])
    ind = np.expand_dims(ind,axis= 1)

    for i,region in enumerate(vor.regions): # enumerate the regions
        if not region: # nicer to skip the empty region altogether
            continue

        flag = True
        for index in region:
            if index == -1:
                flag = False
                break
            else:
                x = vor.vertices[index, 0]
                y = vor.vertices[index, 1]
                if not(bounding_box[0] - eps <= x and x <= bounding_box[1] + eps and
                      bounding_box[2] - eps <= y and y <= bounding_box[3] + eps):
                    flag = False
                    break
        if flag:
            regions.append(region)

           # find the point which lies inside
            points_to_filter.append(vor.points[vor.point_region == i][0,:])

    vor.filtered_points = np.array(points_to_filter)
    vor.filtered_regions = regions
    return vor

def centroid_region(vertices):

    A = 0

    C_x = 0

    C_y = 0
    for i in range(0, len(vertices) - 1):
        s = (vertices[i, 0] * vertices[i + 1, 1] - vertices[i + 1, 0] * vertices[i, 1])
        A = A + s
        C_x = C_x + (vertices[i, 0] + vertices[i + 1, 0]) * s
        C_y = C_y + (vertices[i, 1] + vertices[i + 1, 1]) * s
    A = 0.5 * A
    C_x = (1.0 / (6.0 * A)) * C_x
    C_y = (1.0 / (6.0 * A)) * C_y
    return np.array([[C_x, C_y]])

def plot(r,index):
    vor = voronoi(r, bounding_box)

    fig = pl.figure()
    ax = fig.gca()
    #ax.plot(pol2[:,0],pol2[:,1],'k-')
# Plot initial points
    ax.plot(vor.filtered_points[:, 0], vor.filtered_points[:, 1], 'b.')
    print("initial",vor.filtered_points)
# Plot ridges points
    for region in vor.filtered_regions:
        vertices = vor.vertices[region, :]
        ax.plot(vertices[:, 0], vertices[:, 1], 'go')
# Plot ridges
    for region in vor.filtered_regions:
        vertices = vor.vertices[region + [region[0]], :]
        ax.plot(vertices[:, 0], vertices[:, 1], 'k-')
# Compute and plot centroids
    centroids = []
    for region in vor.filtered_regions:
        vertices = vor.vertices[region + [region[0]], :]
        centroid = centroid_region(vertices)
        centroids.append(list(centroid[0, :]))
        ax.plot(centroid[:, 0], centroid[:, 1], 'r.')
    centroids = np.asarray(centroids)
    rob = np.copy(vor.filtered_points)
    # the below code is for the plotting purpose the update happens in the update function
    interim_x = np.asarray(centroids[:,0] - rob[:,0])
    interim_y = np.asarray(centroids[:,1] - rob[:,1])
    magn = [np.linalg.norm(centroids[i,:] - rob[i,:]) for i in range(rob.shape[0])]
    x = np.copy(interim_x)
    x = np.asarray([interim_x[i]/magn[i] for i in range(interim_x.shape[0])])
    y = np.copy(interim_y)
    y = np.asarray([interim_y[i]/magn[i] for i in range(interim_y.shape[0])])
    nor = np.copy(rob)
    for i in range(x.shape[0]):
        nor[i,0] = x[i]
        nor[i,1] = y[i]
    temp = np.copy(rob)
    temp[:,0] = [rob[i,0] + 0.5*interim_x[i] for i in range(rob.shape[0])]
    temp[:,1] = [rob[i,1] + 0.5*interim_y[i] for i in range(rob.shape[0])]
    pol = [[]]
    ax.plot(temp[:,0] ,temp[:,1], 'y.' )
    ax.set_xlim([-0.1, 1.1])
    ax.set_ylim([-0.1, 1.1])
    pl.savefig("voronoi" + str(index) + ".png")
    return centroids

def update(rob,centroids):

  interim_x = np.asarray(centroids[:,0] - rob[:,0])
  interim_y = np.asarray(centroids[:,1] - rob[:,1])
  magn = [np.linalg.norm(centroids[i,:] - rob[i,:]) for i in range(rob.shape[0])]
  x = np.copy(interim_x)
  x = np.asarray([interim_x[i]/magn[i] for i in range(interim_x.shape[0])])
  y = np.copy(interim_y)
  y = np.asarray([interim_y[i]/magn[i] for i in range(interim_y.shape[0])])
  nor = [np.linalg.norm([x[i],y[i]]) for i in range(x.shape[0])]
  temp = np.copy(rob)
  temp[:,0] = [rob[i,0] + 0.5*interim_x[i] for i in range(rob.shape[0])]
  temp[:,1] = [rob[i,1] + 0.5*interim_y[i] for i in range(rob.shape[0])]
  return np.asarray(temp)

if __name__ == '__main__':
    for i in range(1):
        centroids = plot(robots,i)
        robots = update(robots,centroids)
如果有人能帮我,我会非常非常感激。