我正在尝试使用Python生成一个随机轮廓的图像,但是我找不到简单的方法。
这是一个我想要的样例:
起初我考虑使用matplotlib和高斯函数来实现,但我甚至无法接近我所展示的图像。
有没有简单的方法可以实现呢?
非常感谢任何帮助。
我正在尝试使用Python生成一个随机轮廓的图像,但是我找不到简单的方法。
这是一个我想要的样例:
起初我考虑使用matplotlib和高斯函数来实现,但我甚至无法接近我所展示的图像。
有没有简单的方法可以实现呢?
非常感谢任何帮助。
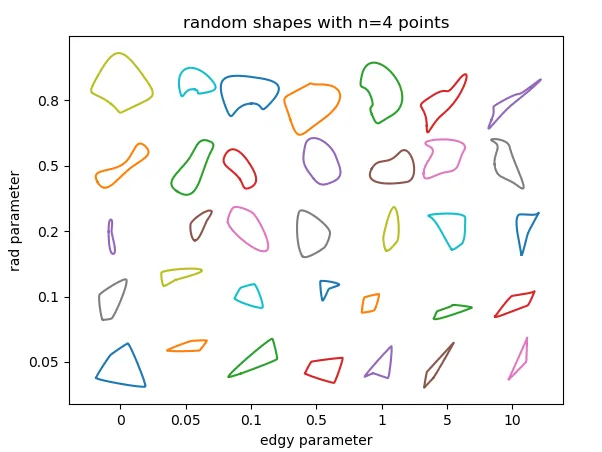
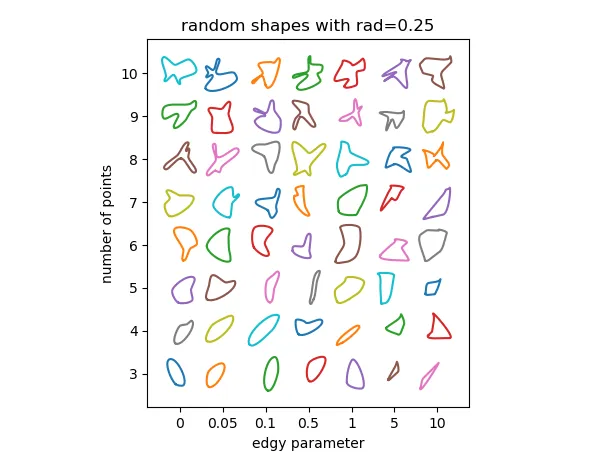
get_random_points创建一组随机点,并使用函数get_bezier_curve对其进行调用。这将创建一组贝塞尔曲线,这些曲线在输入点处平滑连接在一起。我们还确保它们是环形的,即起点和终点之间的过渡也是平滑的。import numpy as np
from scipy.special import binom
import matplotlib.pyplot as plt
bernstein = lambda n, k, t: binom(n,k)* t**k * (1.-t)**(n-k)
def bezier(points, num=200):
N = len(points)
t = np.linspace(0, 1, num=num)
curve = np.zeros((num, 2))
for i in range(N):
curve += np.outer(bernstein(N - 1, i, t), points[i])
return curve
class Segment():
def __init__(self, p1, p2, angle1, angle2, **kw):
self.p1 = p1; self.p2 = p2
self.angle1 = angle1; self.angle2 = angle2
self.numpoints = kw.get("numpoints", 100)
r = kw.get("r", 0.3)
d = np.sqrt(np.sum((self.p2-self.p1)**2))
self.r = r*d
self.p = np.zeros((4,2))
self.p[0,:] = self.p1[:]
self.p[3,:] = self.p2[:]
self.calc_intermediate_points(self.r)
def calc_intermediate_points(self,r):
self.p[1,:] = self.p1 + np.array([self.r*np.cos(self.angle1),
self.r*np.sin(self.angle1)])
self.p[2,:] = self.p2 + np.array([self.r*np.cos(self.angle2+np.pi),
self.r*np.sin(self.angle2+np.pi)])
self.curve = bezier(self.p,self.numpoints)
def get_curve(points, **kw):
segments = []
for i in range(len(points)-1):
seg = Segment(points[i,:2], points[i+1,:2], points[i,2],points[i+1,2],**kw)
segments.append(seg)
curve = np.concatenate([s.curve for s in segments])
return segments, curve
def ccw_sort(p):
d = p-np.mean(p,axis=0)
s = np.arctan2(d[:,0], d[:,1])
return p[np.argsort(s),:]
def get_bezier_curve(a, rad=0.2, edgy=0):
""" given an array of points *a*, create a curve through
those points.
*rad* is a number between 0 and 1 to steer the distance of
control points.
*edgy* is a parameter which controls how "edgy" the curve is,
edgy=0 is smoothest."""
p = np.arctan(edgy)/np.pi+.5
a = ccw_sort(a)
a = np.append(a, np.atleast_2d(a[0,:]), axis=0)
d = np.diff(a, axis=0)
ang = np.arctan2(d[:,1],d[:,0])
f = lambda ang : (ang>=0)*ang + (ang<0)*(ang+2*np.pi)
ang = f(ang)
ang1 = ang
ang2 = np.roll(ang,1)
ang = p*ang1 + (1-p)*ang2 + (np.abs(ang2-ang1) > np.pi )*np.pi
ang = np.append(ang, [ang[0]])
a = np.append(a, np.atleast_2d(ang).T, axis=1)
s, c = get_curve(a, r=rad, method="var")
x,y = c.T
return x,y, a
def get_random_points(n=5, scale=0.8, mindst=None, rec=0):
""" create n random points in the unit square, which are *mindst*
apart, then scale them."""
mindst = mindst or .7/n
a = np.random.rand(n,2)
d = np.sqrt(np.sum(np.diff(ccw_sort(a), axis=0), axis=1)**2)
if np.all(d >= mindst) or rec>=200:
return a*scale
else:
return get_random_points(n=n, scale=scale, mindst=mindst, rec=rec+1)
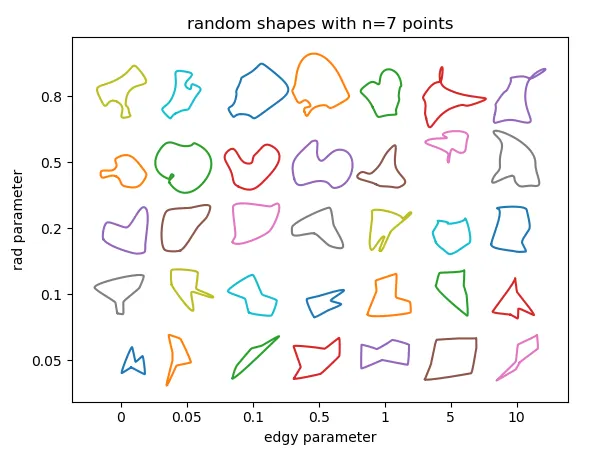
你可以将这些函数用作:
fig, ax = plt.subplots()
ax.set_aspect("equal")

rad = 0.2
edgy = 0.05

for c in np.array([[0,0], [0,1], [1,0], [1,1]]):

    a = get_random_points(n=7, scale=1) + c
    x,y, _ = get_bezier_curve(a,rad=rad, edgy=edgy)
    plt.plot(x,y)

plt.show()

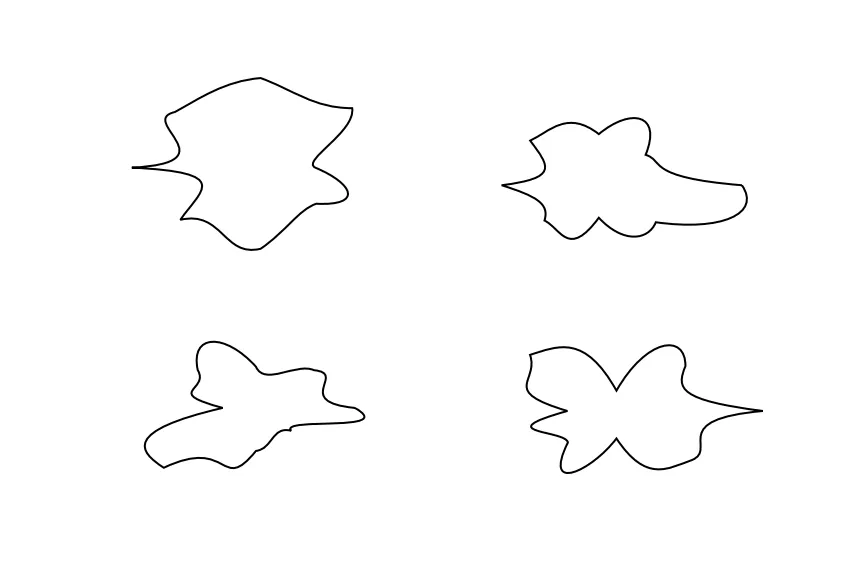
使用matplotlib.path模块是实现随机且相当平滑的形状的简单方法。
通过使用三次贝塞尔曲线,大多数线条将被平滑处理,锐利边缘的数量将是需要调整的参数之一。
步骤如下。首先定义形状的参数,这些参数是锐利边缘的数量n和相对于单位圆中的默认位置的最大扰动r。在此示例中,点从单位圆移动,带有径向校正,该校正修改了半径从1到随机数之间的值1-r,1+r。
这就是为什么顶点被定义为相应角度的正弦或余弦乘以半径因子,以将点放置在圆圈中,然后修改其半径以引入随机组件。 stack,.T转置和[:,None]仅用于将数组转换为matplotlib接受的输入。
以下是使用这种径向修正的示例:
import numpy as np

import matplotlib.pyplot as plt
from matplotlib.path import Path
import matplotlib.patches as patches

n = 8 # Number of possibly sharp edges
r = .7 # magnitude of the perturbation from the unit circle,
# should be between 0 and 1
N = n*3+1 # number of points in the Path
# There is the initial point and 3 points per cubic bezier curve. Thus, the curve will only pass though n points, which will be the sharp edges, the other 2 modify the shape of the bezier curve

angles = np.linspace(0,2*np.pi,N)
codes = np.full(N,Path.CURVE4)
codes[0] = Path.MOVETO

verts = np.stack((np.cos(angles),np.sin(angles))).T*(2*r*np.random.random(N)+1-r)[:,None]
verts[-1,:] = verts[0,:] # Using this instad of Path.CLOSEPOLY avoids an innecessary straight line
path = Path(verts, codes)

fig = plt.figure()
ax = fig.add_subplot(111)
patch = patches.PathPatch(path, facecolor='none', lw=2)
ax.add_patch(patch)

ax.set_xlim(np.min(verts)*1.1, np.max(verts)*1.1)
ax.set_ylim(np.min(verts)*1.1, np.max(verts)*1.1)
ax.axis('off') # removes the axis to leave only the shape

plt.show()
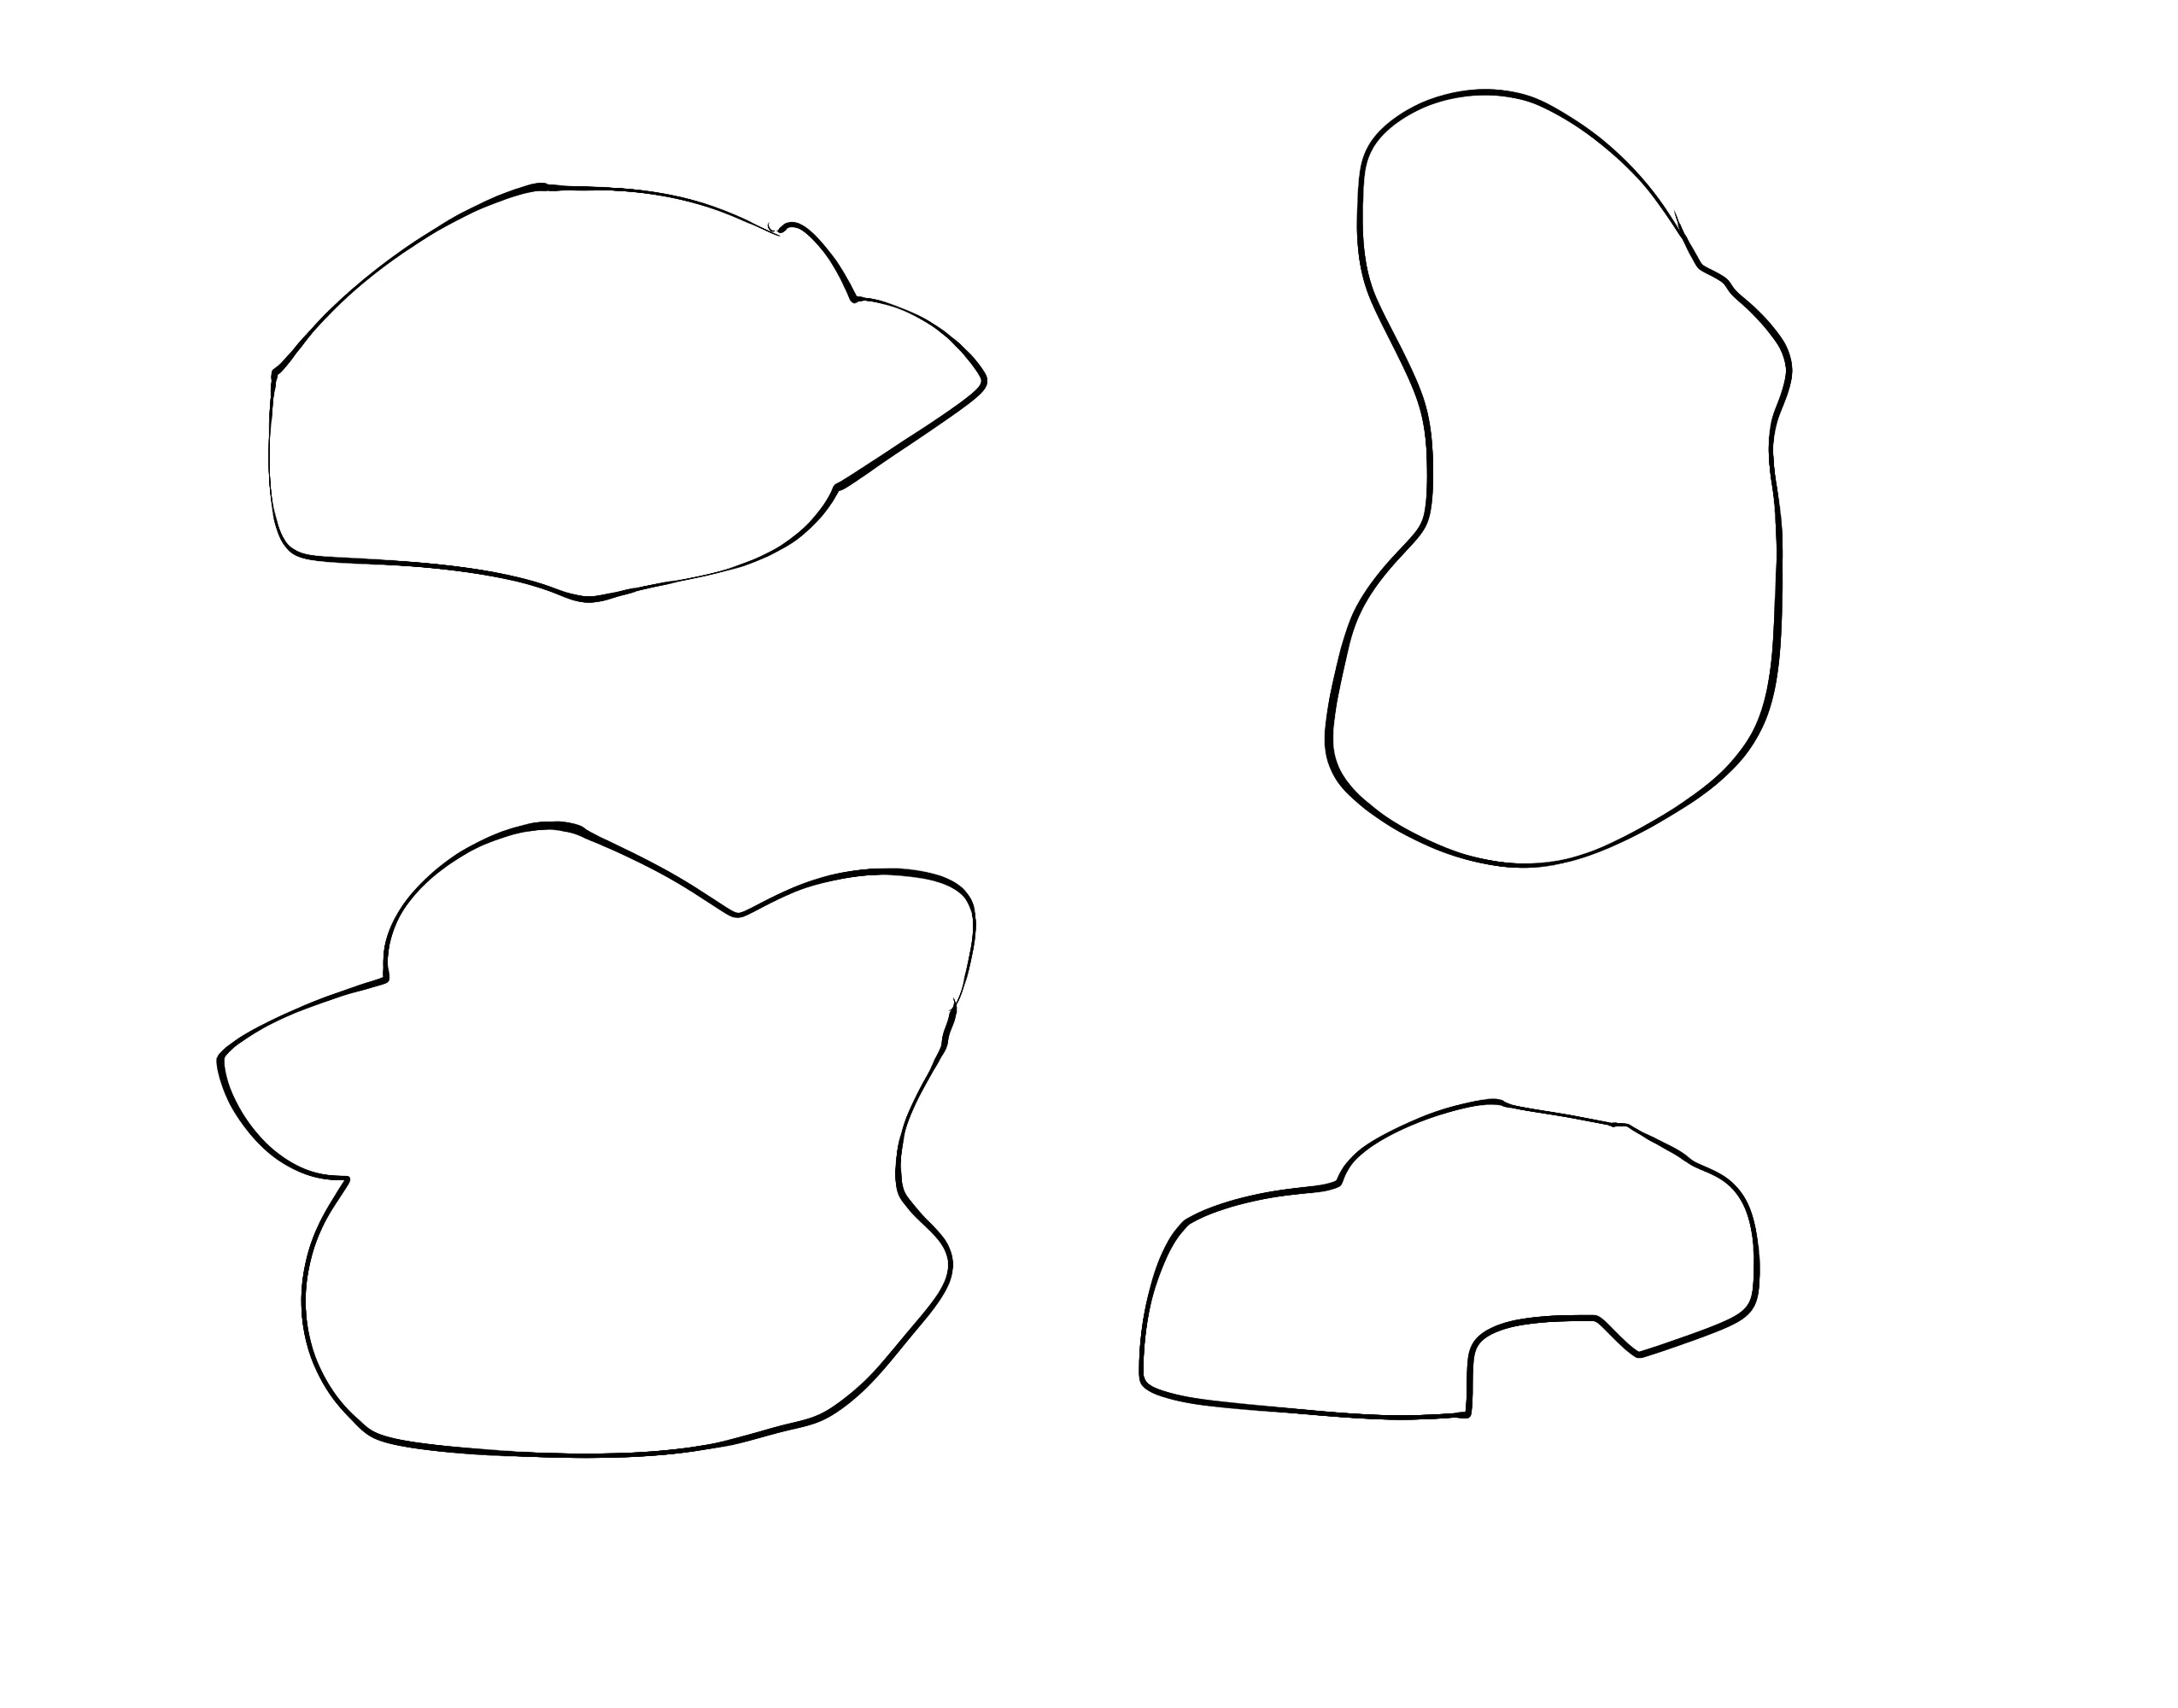
当 n=8 和 r=0.7 时,会产生如下形状:
还有一种选择是使用上面的代码生成单个形状,然后使用scipy执行高斯过滤来生成图形。
执行高斯滤波并获取平滑的形状的主要思想是创建填充形状;将图像保存为2d数组(其值将介于0和1之间,因为它将是灰度图像);然后应用高斯滤波器;最终,将平滑的形状作为过滤后数组的0.5轮廓。
因此,这个第二个版本看起来像这样:
# additional imports
from skimage import color as skolor # see the docs at scikit-image.org/
from skimage import measure
from scipy.ndimage import gaussian_filter
sigma = 7 # smoothing parameter
# ...
path = Path(verts, codes)
fig = plt.figure()
ax = fig.add_axes([0,0,1,1]) # create the subplot filling the whole figure
patch = patches.PathPatch(path, facecolor='k', lw=2) # Fill the shape in black
# ...
ax.axis('off')
fig.canvas.draw()
##### Smoothing ####
# get the image as an array of values between 0 and 1
data = np.frombuffer(fig.canvas.tostring_rgb(), dtype=np.uint8)
data = data.reshape(fig.canvas.get_width_height()[::-1] + (3,))
gray_image = skolor.rgb2gray(data)
# filter the image
smoothed_image = gaussian_filter(gray_image,sigma)
# Retrive smoothed shape as 0.5 contour
smooth_contour = measure.find_contours(smoothed_image[::-1,:], 0.5)[0]
# Note, the values of the contour will range from 0 to smoothed_image.shape[0]
# and likewise for the second dimension, if desired,
# they should be rescaled to go between 0,1 afterwards
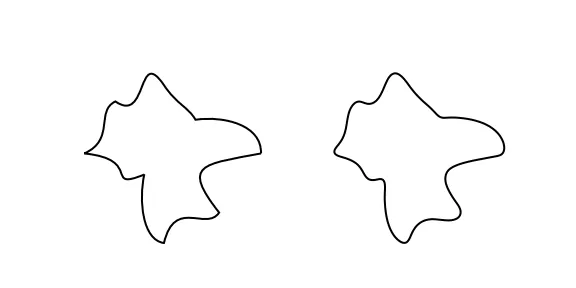
# compare smoothed ans original shape
fig = plt.figure(figsize=(8,4))
ax1 = fig.add_subplot(1,2,1)
patch = patches.PathPatch(path, facecolor='none', lw=2)
ax1.add_patch(patch)
ax1.set_xlim(np.min(verts)*1.1, np.max(verts)*1.1)
ax1.set_ylim(np.min(verts)*1.1, np.max(verts)*1.1)
ax1.axis('off') # removes the axis to leave only the shape
ax2 = fig.add_subplot(1,2,2)
ax2.plot(smooth_contour[:, 1], smooth_contour[:, 0], linewidth=2, c='k')
ax2.axis('off')