我希望能够绘制一条线,并且该线的宽度是以数据单位指定的。在这种情况下,只需要执行以下操作:
这意味着,
那么如果
例如,我希望填充
显然,这并不像预期的那样有效:
plot(x, y, linewidth=1)
如果 linewidth 没有在数据单位中指定,将会失败。
为了解决这个问题,我找到了fill_between(),但是我发现这里给出的所有示例都是以下格式:
fill_between(x, y1, y2)
这意味着,
x 始终由 y1 和 y2 共享。那么如果
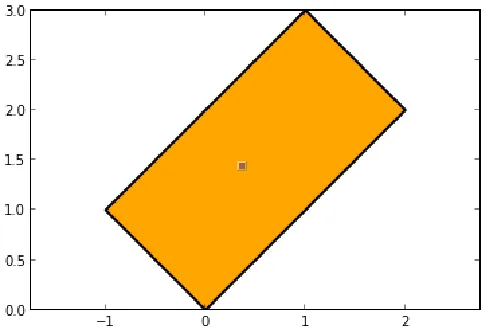
y1和y2没有共享相同的x呢?例如,我希望填充
line1=[(0, 0), (2, 2)] 和 line2=[(-1, 1), (1, 3)](实际上,它们形成了一个矩形)。在这种情况下,我需要类似于以下的东西:fill_between(x1, x2, y1, y2)
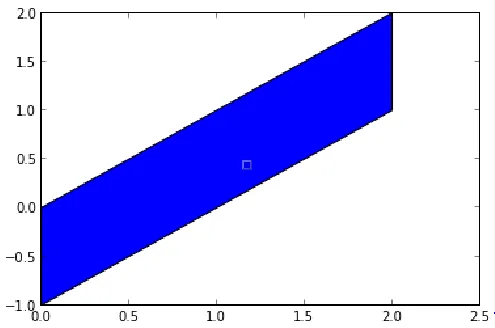
显然,这并不像预期的那样有效:
In [132]: x1 = [0,2]
   .....: x2 = [-1, 1]
   .....: y1 = [0,2]
   .....: y2 = [1,3]
   .....: fill_between(x1, x2, y1, y2)
   .....:
Out[132]: <matplotlib.collections.PolyCollection at 0x3e5b230>
np.atan2的问题。 - tacaswell