我希望在我的绘图旁边不是画一个色条,而是画一个填充了颜色映射的小矩形作为图例。
我已经可以通过以下方法绘制填充任何颜色的小矩形:
axis0, = myax.plot([], linewidth=10, color='r')

axis =[axis0]
legend=['mytext']

plt.legend(axis,
           legend)
我可以使用颜色映射来做同样的事情吗?谢谢!
我希望在我的绘图旁边不是画一个色条,而是画一个填充了颜色映射的小矩形作为图例。
我已经可以通过以下方法绘制填充任何颜色的小矩形:
axis0, = myax.plot([], linewidth=10, color='r')
axis =[axis0]
legend=['mytext']
plt.legend(axis,
legend)
import numpy as np # v 1.19.2
import matplotlib.pyplot as plt # v 3.3.2
import matplotlib.patches as patches
from matplotlib.legend_handler import HandlerTuple
rng = np.random.default_rng(seed=1)
ncmaps = 5 # number of colormaps to draw for illustration
ncolors = 100 # number high enough to draw a smooth gradient for each colormap
# Create random list of colormaps and extract list of colors to
# draw the gradient of each colormap
cmaps_names = list(rng.choice(plt.colormaps(), size=ncmaps))
cmaps = [plt.cm.get_cmap(name) for name in cmaps_names]
cmaps_gradients = [cmap(np.linspace(0, 1, ncolors)) for cmap in cmaps]
cmaps_dict = dict(zip(cmaps_names, cmaps_gradients))
# Create a list of lists of patches representing the gradient of each colormap
patches_cmaps_gradients = []
for cmap_name, cmap_colors in cmaps_dict.items():
cmap_gradient = [patches.Patch(facecolor=c, edgecolor=c, label=cmap_name)
for c in cmap_colors]
patches_cmaps_gradients.append(cmap_gradient)
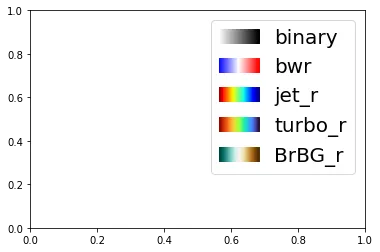
# Create custom legend (with a large fontsize to better illustrate the result)
plt.legend(handles=patches_cmaps_gradients, labels=cmaps_names, fontsize=20,
handler_map={list: HandlerTuple(ndivide=None, pad=0)})
plt.show()