我有一个简单的散点图,每个点的颜色由0到1之间的值设置为所选择的色图。这是我的代码的MWE:
import matplotlib.pyplot as plt
import numpy as np
import matplotlib.gridspec as gridspec

x = np.random.randn(60)
y = np.random.randn(60)
z = [np.random.random() for _ in range(60)]

fig = plt.figure()
gs = gridspec.GridSpec(1, 2)

ax0 = plt.subplot(gs[0, 0])
plt.scatter(x, y, s=20)

ax1 = plt.subplot(gs[0, 1])
cm = plt.cm.get_cmap('RdYlBu_r')
plt.scatter(x, y, s=20 ,c=z, cmap=cm)
cbaxes = fig.add_axes([0.6, 0.12, 0.1, 0.02])
plt.colorbar(cax=cbaxes, ticks=[0.,1], orientation='horizontal')

fig.tight_layout()
plt.show()
它看起来像这样:
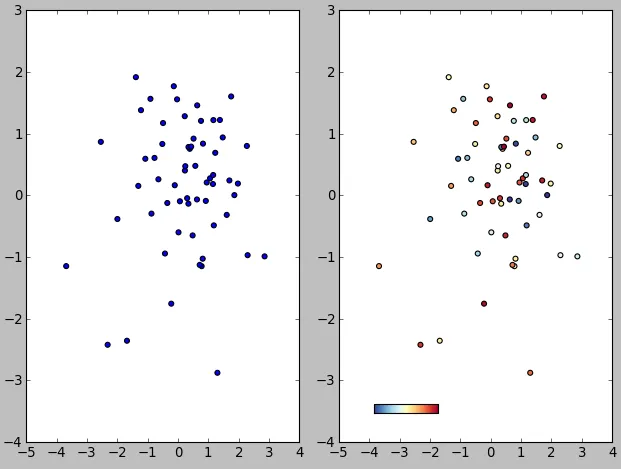
问题在于我想让小的水平色条位于绘图的左下角,但是使用cax参数不仅感觉有点hacky,而且会与tight_layout发生冲突,导致出现警告:
/usr/local/lib/python2.7/dist-packages/matplotlib/figure.py:1533: UserWarning: This figure includes Axes that are not compatible with tight_layout, so its results might be incorrect.
  warnings.warn("This figure includes Axes that are not "
有没有更好的方法来定位色条,而不会在每次运行代码时都收到一个讨厌的警告?
编辑
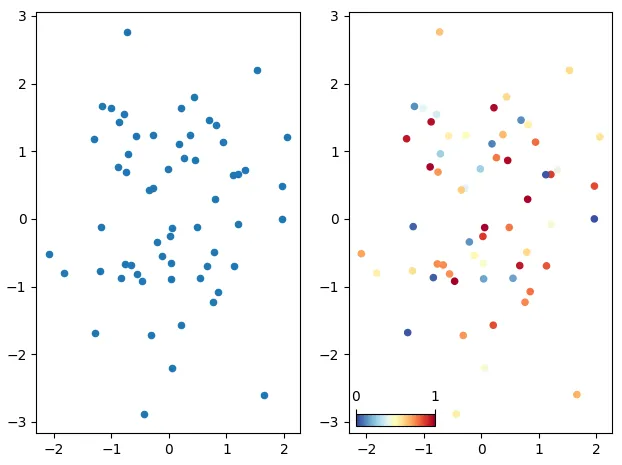
我希望颜色条仅显示最大和最小值,即0和1,并且Joe通过在scatter中添加vmin=0, vmax=1来帮助我实现了这一点:
plt.scatter(x, y, s=20, vmin=0, vmax=1)
所以我将删除问题的这部分内容。
tight_layout不会考虑色条的位置。对于第二个问题,实际上是因为您的色条的最小值和最大值并不完全在0和1处。(默认情况下,scatter等函数将其设置为数据的确切最小值和最大值)。如果您传递vmin=0,vmax=1给scatter,则刻度将显示出来。 - Joe Kingtonvmin=0,vmax=1的方法可行,所以我将从问题中删除该部分,谢谢! - Gabrieltight_layout只能处理子图的收缩和放大。如果你有不是子图的坐标轴,它会发出这个警告。你想要有不是子图的坐标轴(颜色条)。你基本上有 3 个选项:a) 捕捉特定的警告并将其静音,b) 关闭警告,c) 不使用tight_layout,而使用subplots_adjust代替。(tight_layout只是自动计算输入到subplots_adjust的值。)希望这能帮到你一点! - Joe Kington