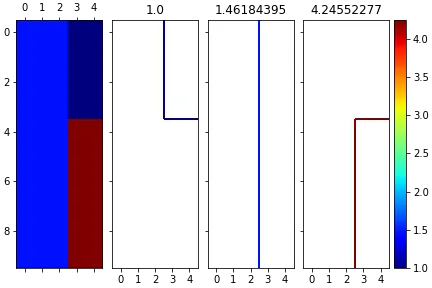
我在提取以下数据的精确轮廓方面遇到了困难:(您可以通过查看数据来看到轮廓)
如果我绘制它:
data = np.array(
      [[ 1.46184395,  1.46184395,  1.46184395,  1.        ,  1.        ],
       [ 1.46184395,  1.46184395,  1.46184395,  1.        ,  1.        ],
       [ 1.46184395,  1.46184395,  1.46184395,  1.        ,  1.        ],
       [ 1.46184395,  1.46184395,  1.46184395,  1.        ,  1.        ],
       [ 1.46184395,  1.46184395,  1.46184395,  4.24552277,  4.24552277],
       [ 1.46184395,  1.46184395,  1.46184395,  4.24552277,  4.24552277],
       [ 1.46184395,  1.46184395,  1.46184395,  4.24552277,  4.24552277],
       [ 1.46184395,  1.46184395,  1.46184395,  4.24552277,  4.24552277],
       [ 1.46184395,  1.46184395,  1.46184395,  4.24552277,  4.24552277],
       [ 1.46184395,  1.46184395,  1.46184395,  4.24552277,  4.24552277]])
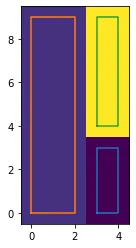
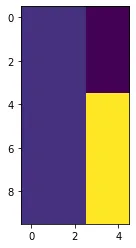
如果我绘制它:
plt.imshow(data)
plt.contour(data, levels = np.unique(data))
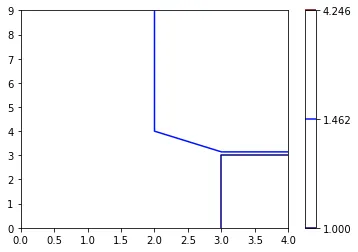
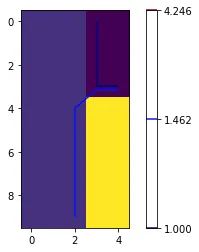
正如您所看到的,轮廓并未跟随实际数据的尖角。如果我将两个图层叠加:
这里是完整的代码:
import numpy as np
import matplotlib.pyplot as plt

data = np.array([[ 1.46184395,  1.46184395,  1.46184395,  1.        ,  1.        ],
       [ 1.46184395,  1.46184395,  1.46184395,  1.        ,  1.        ],
       [ 1.46184395,  1.46184395,  1.46184395,  1.        ,  1.        ],
       [ 1.46184395,  1.46184395,  1.46184395,  1.        ,  1.        ],
       [ 1.46184395,  1.46184395,  1.46184395,  4.24552277,  4.24552277],
       [ 1.46184395,  1.46184395,  1.46184395,  4.24552277,  4.24552277],
       [ 1.46184395,  1.46184395,  1.46184395,  4.24552277,  4.24552277],
       [ 1.46184395,  1.46184395,  1.46184395,  4.24552277,  4.24552277],
       [ 1.46184395,  1.46184395,  1.46184395,  4.24552277,  4.24552277],
       [ 1.46184395,  1.46184395,  1.46184395,  4.24552277,  4.24552277]])

plt.imshow(data)
plt.show()
plt.contour(data, levels=np.unique(data), cmap="jet")
plt.colorbar()