我希望在
在
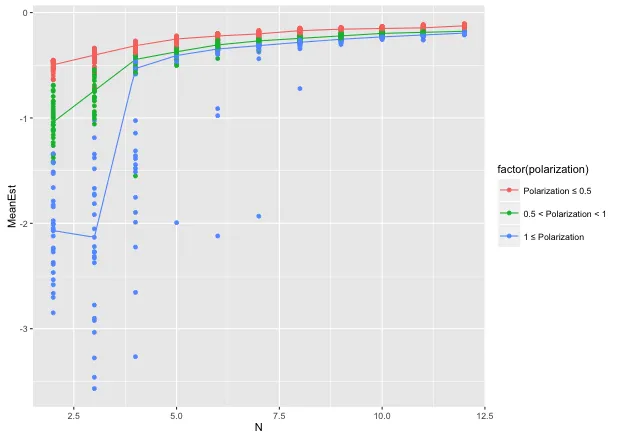
ggplot2散点图上添加中位数样条和相应的置信区间带。我正在使用‘quantreg’包,更具体地是使用rqss函数(加性分位数回归平滑)。在
ggplot2中,我能够添加中位数样条,但无法添加置信区间带:fig = ggplot(dd, aes(y = MeanEst, x = N, colour = factor(polarization)))
fig + stat_quantile(quantiles=0.5, formula = y ~ qss(x), method = "rqss") +
geom_point()
“quantreg”包自带绘图函数:plot.rqss。我可以通过添加置信区间(bands=TRUE)来绘制图形:
plot(1, type="n", xlab="", ylab="", xlim=c(2, 12), ylim=c(-3, 0)) # empty plot
plotfigs = function(df) {
  rqss_model = rqss(df$MeanEst ~ qss(df$N))
  plot(rqss_model, bands=TRUE, add=TRUE, rug=FALSE, jit=FALSE)
  return(NULL)
}
figures = lapply(split(dd, as.factor(dd$polarization)), plotfigs)
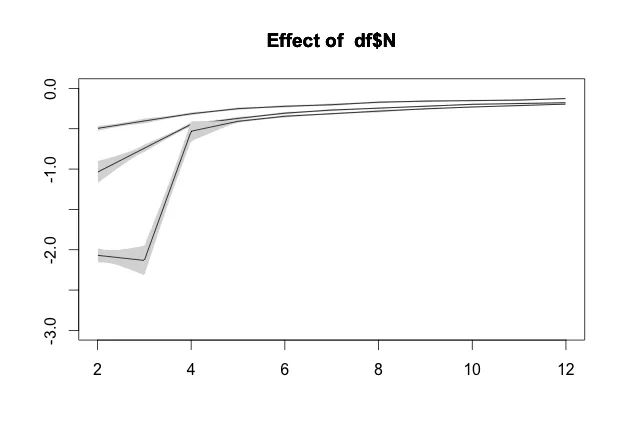
然而,随着quantreg软件包所提供的绘图函数不太灵活/不适合我的需求。是否可以在ggplot2的图表中得到置信区间?也许通过模仿quantreg软件包中使用的方法来实现,或者只是从该图表中复制它们?
数据:pastebin。