我想做类似于这个帖子中的答案,但是使用geom_segment()代替geom_path(),因为现在我想要在我的线上添加箭头。
设置:
example <- data.frame(r=c(5,4,3),theta=c(0.9,1.1,0.6))

is.linear.polar2 <- function(x) TRUE
coord_polar2 <- coord_polar(theta="y", start = 3/2*pi, direction=-1)
class(coord_polar2) <- c("polar2", class(coord_polar2))

myplot <- ggplot(example, aes(r, theta)) + geom_point(size=3.5) +
  scale_x_continuous(breaks=seq(0,max(example$r)), lim=c(0, max(example$r))) +
  scale_y_continuous(breaks=round(seq(0, 2*pi, by=pi/4),2), expand=c(0,0), lim=c(0,2*pi)) +
  geom_text(aes(label=rownames(example)), size=4.4, hjust=0.5, vjust=-1)

myplot + coord_polar2 + geom_path()
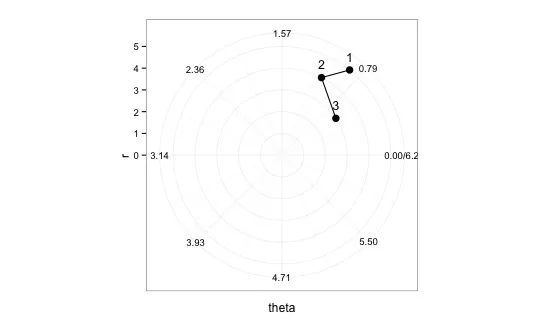
我希望有一个类似这样的图表,但是箭头要指向序列中下一个点。
这是我的尝试:
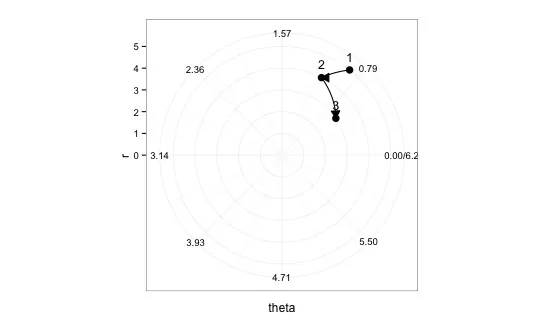
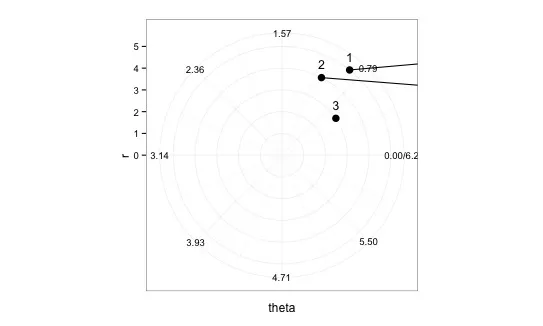
myplot + coord_polar2 +
geom_segment(data=example,aes(x=r, y=theta, xend=c(tail(r, n=-1), NA),
                              yend=c(tail(theta, n=-1), NA)),
             arrow=arrow(length=unit(0.3,"cm"), type="closed"))
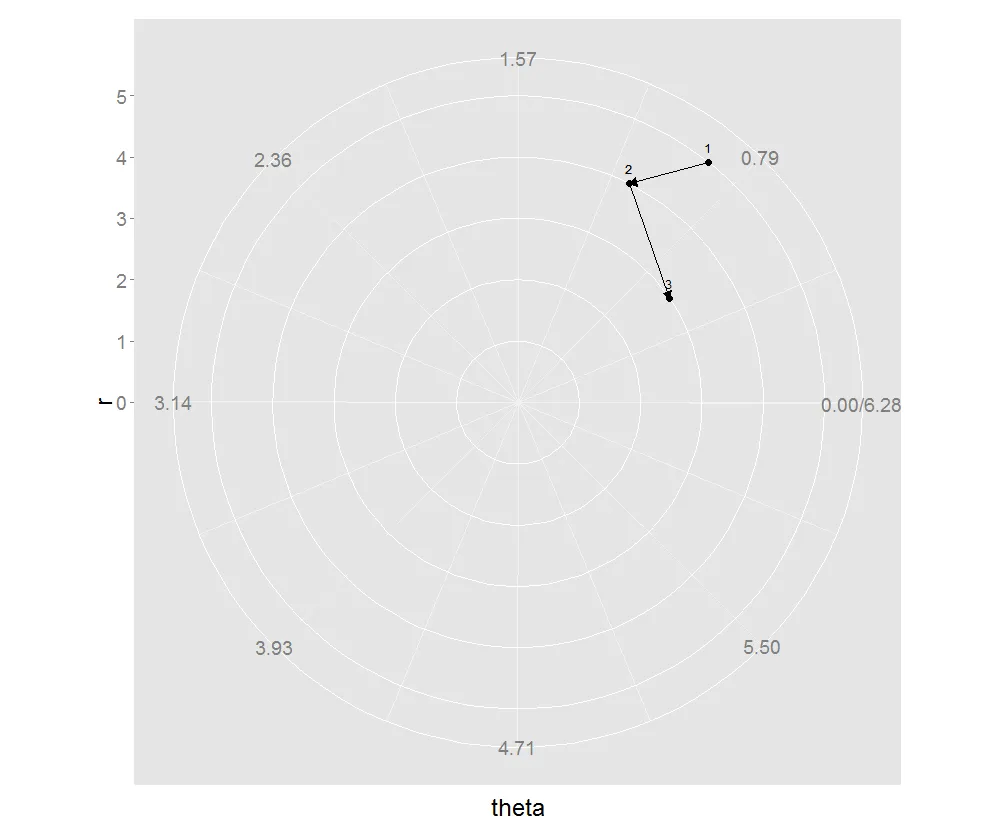
myplot + coord_polar(theta="y", start = 3/2*pi, direction=-1) +
geom_segment(data=example,aes(x=r, y=theta, xend=c(tail(r, n=-1), NA),
                              yend=c(tail(theta, n=-1), NA)),
             arrow=arrow(length=unit(0.3,"cm"), type="closed"))