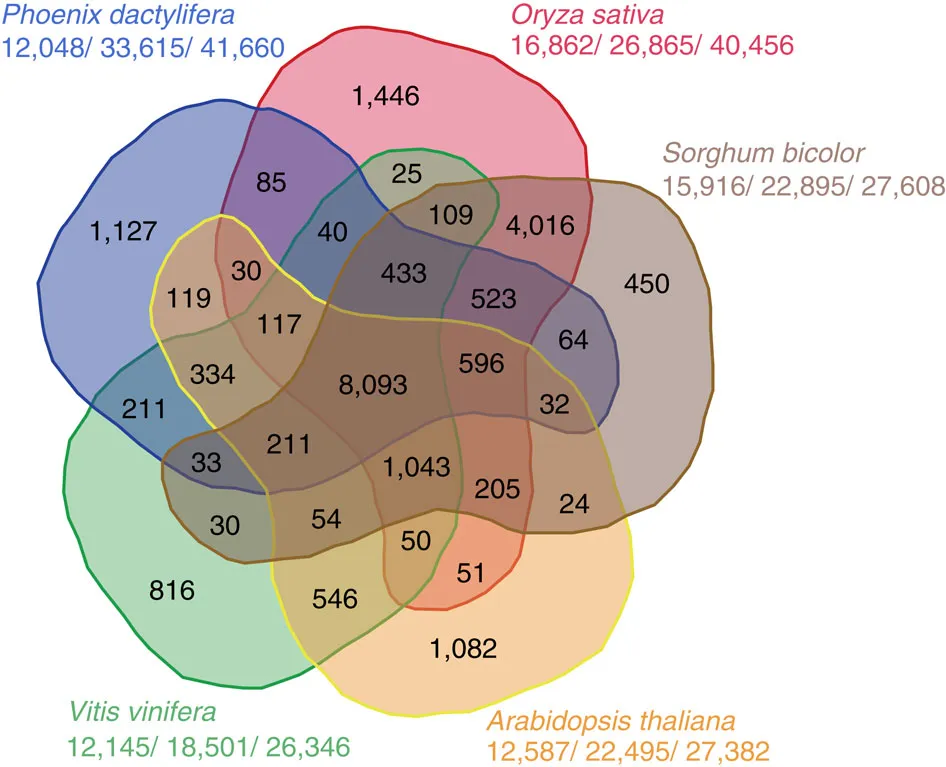
我最近看到一篇很好的五组文氏图,如下:
有没有人知道如何用 R 编写生成这样文氏图的代码?
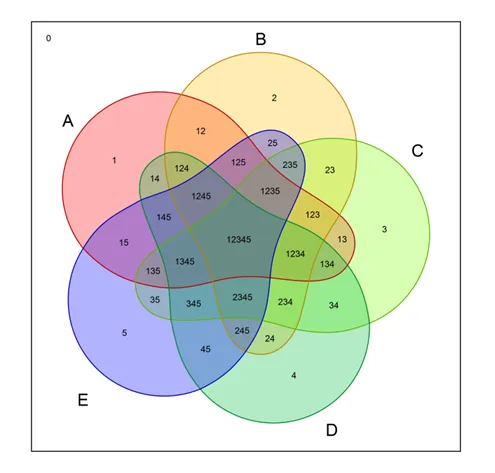
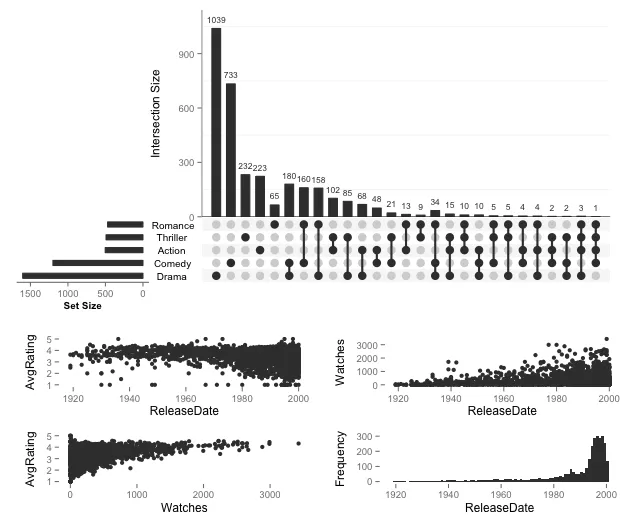
我查看的大多数软件包似乎生成了不太清晰的版本:
有什么想法吗?
编辑:看起来 Nature 文章使用了这个 Web 工具:http://bioinformatics.psb.ugent.be/webtools/Venn/ 可能将其移植到某些 R 包中仍然不错,尤其是目前任何我知道的软件包中都没有的非对称文氏图。
我最近看到一篇很好的五组文氏图,如下:
有没有人知道如何用 R 编写生成这样文氏图的代码?
我查看的大多数软件包似乎生成了不太清晰的版本:
有什么想法吗?
编辑:看起来 Nature 文章使用了这个 Web 工具:http://bioinformatics.psb.ugent.be/webtools/Venn/ 可能将其移植到某些 R 包中仍然不错,尤其是目前任何我知道的软件包中都没有的非对称文氏图。
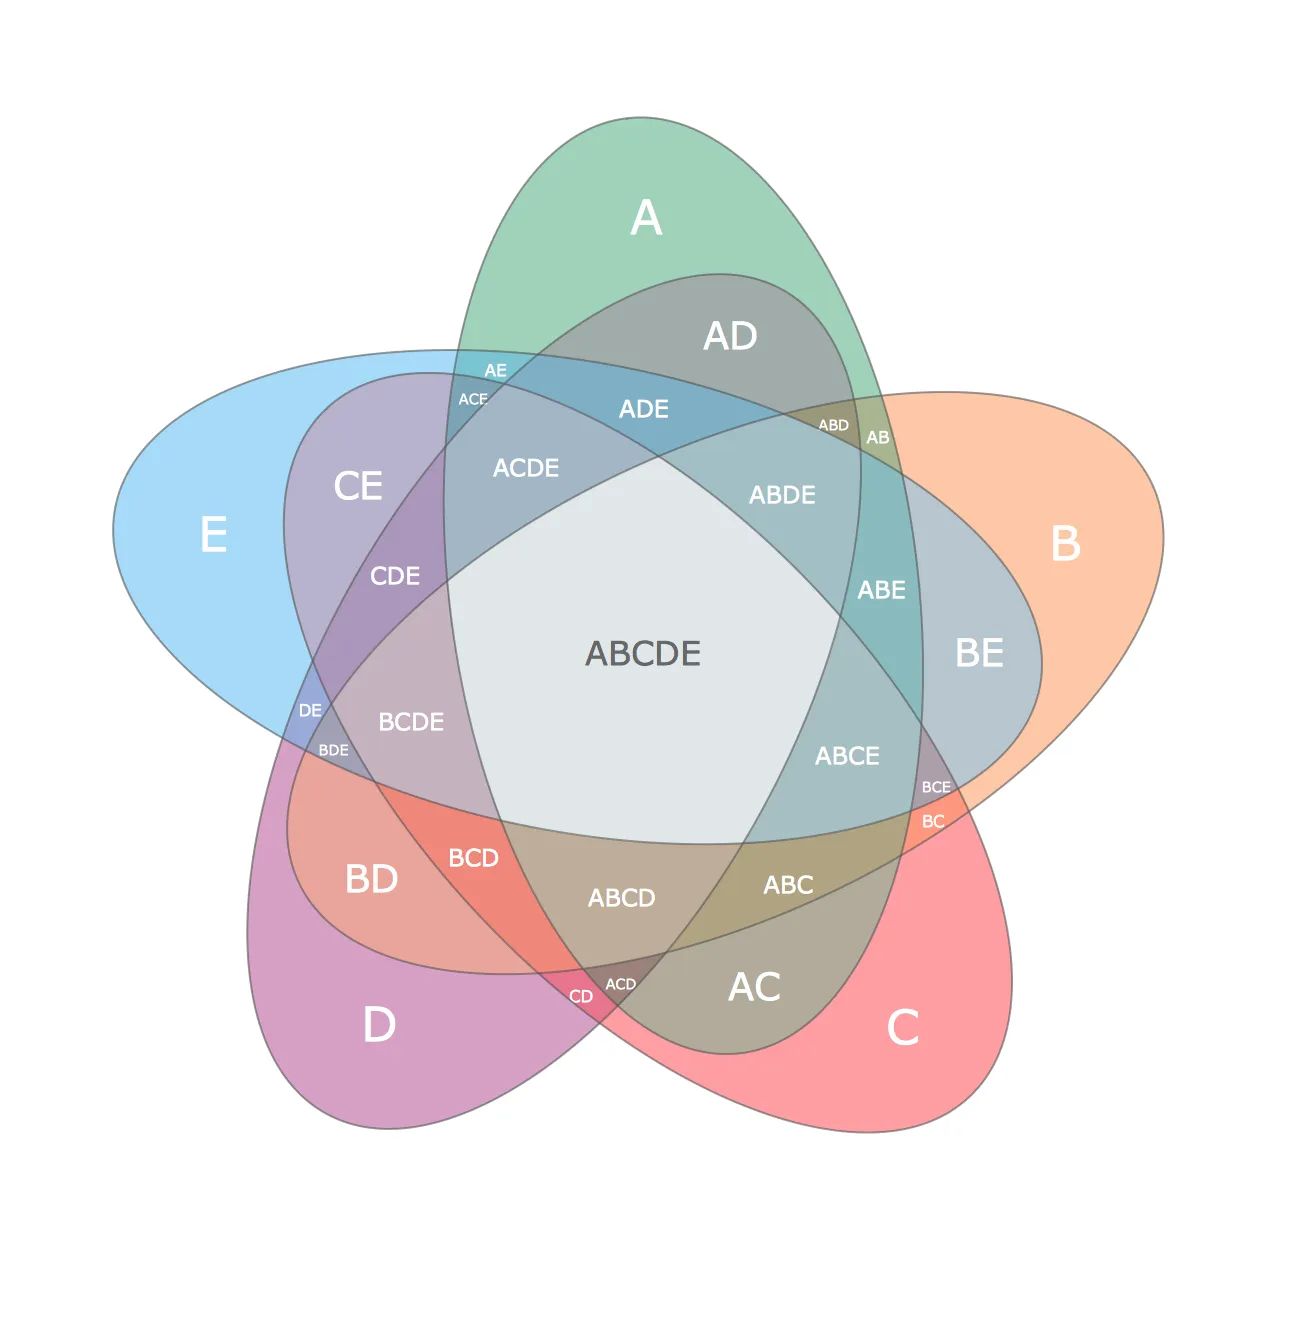
library(venn)
venn(5, ilab=TRUE, zcolor = "style")
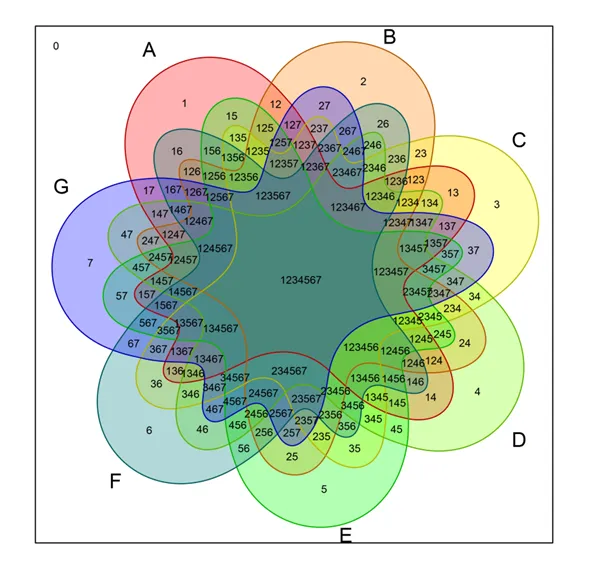
venn(7, ilab=TRUE, zcolor = "style")
我还在Ghent大学生物信息学网站上使用了在线的Venn图生成器,我也想要自己的函数。当然,想法是让每个交集区域的大小合理,以便计数的文本可以是相同的大小。这里是我的尝试:
fiveCellVenn <- function(colorList=col2rgb(rainbow(5)),
                         cellCounts=seq(1,31,1),
                         cellLabels=c("one","two","three","four","five"),
                         saturation=.25){
  rotateVec <-function(vec,amount){
    return(c(vec[(amount+1):length(vec)], vec[1:amount]))
  }
  n=70
  xhull <- c()
  yhull <- c()
  for (i in 1:n){
    xhull <- c(xhull, cos((i*2*pi)/n))
    yhull <- c(yhull, sin((i*2*pi)/n))
  }
## The Venn cells begin as a 70-sided regular polygon
## plot(xhull, yhull)
## polygon(xhull, yhull)
## Multiply each unit vector in the hull by a scalar, arrived at by
## iterative adjustment.
  adjust <-c(10,10.35,10.6,10.5,10.4,10.3,10.1,9.6,9,8.5,
             8,7.625,7.25,7.125,7,6.875,6.75,6.875,7,7.125,
             7.25,7.625,8.1,9.125,10.25,11.375,12.5,13.15,13.8,14.3,
             14.6,14.725,14.7,14.7,14.7,14.4,14.1,13.8,13.5,12.8,
             12.1,11.15,10.2,9.6,8.95,8.3,7.7,7,6.25,5.6,
             5,4.75,4.5,4.25,4,3.8,3.6,3.45,3.45,3.45,
             3.5,3.625,3.75,3.825,4,4.25,4.5,5.75,7.25,8.5)
  newxhull <- xhull*adjust
  newyhull <- yhull*adjust
## Text location was also done by hand:
  textLocationX <- c(-13,-3,8,9,-4,-7.5,7.5,-9,-8,4,6.5,-2,9,-4,1.4,4,-7.5,-3.5,7.5,-6,-6.5,6,1.5,4,-0.5,4.5,0,-5,-3.5,3.5,0)
  textLocationY <- c(1,12,8,-8,-12,6.5,4.5,1,-4,8.5,-6,8.5,-1.5,-8,-9,5,3.5,6,1.5,-6,-1.5,-2,8,-7,-6.5,2,5.5,2,-3.5,-4,0)
  textLocationMatrix <- matrix(cbind(textLocationX,textLocationY),nrow=31,ncol=2)
  plot(newxhull, newyhull, pch=".", xlim=c(-16,16), ylim=c(-16,16),
       axes=FALSE,xlab="",ylab="")
  newAdjust<-adjust
  for (i in 1:5){
    newxhull <- xhull*newAdjust
    newyhull <- yhull*newAdjust
    polygon(newxhull, newyhull,
            border=rgb(colorList[1,i]/255, colorList[2,i]/255, colorList[3,i]/255, 1),
            lwd=2,
            col=rgb(colorList[1,i]/255, colorList[2,i]/255, colorList[3,i]/255,saturation))
    newAdjust <- rotateVec(newAdjust,14)
  }
  text(textLocationMatrix[,1], textLocationMatrix[,2],labels=as.character(cellCounts))
  text(textLocationMatrix[c(17,2,3,24,14),1]*c(2,1.25,1.5,2,2),
       textLocationMatrix[c(17,2,3,24,14),2]*c(2,1.35,1.5,2,2),
       labels=cellLabels)
##  uncomment and run to get points and grid for adjusting text location
##  points(textLocationMatrix[,1], textLocationMatrix[,2])
##  for (i in -16:16){
##   if (i%%5==0){
##     color="black"
##   }else{
##     color="lightblue"
##   }
##  abline(v=i,col=color)
##  abline(h=i, col=color)
##  }
}
那么
fiveCellVenn()
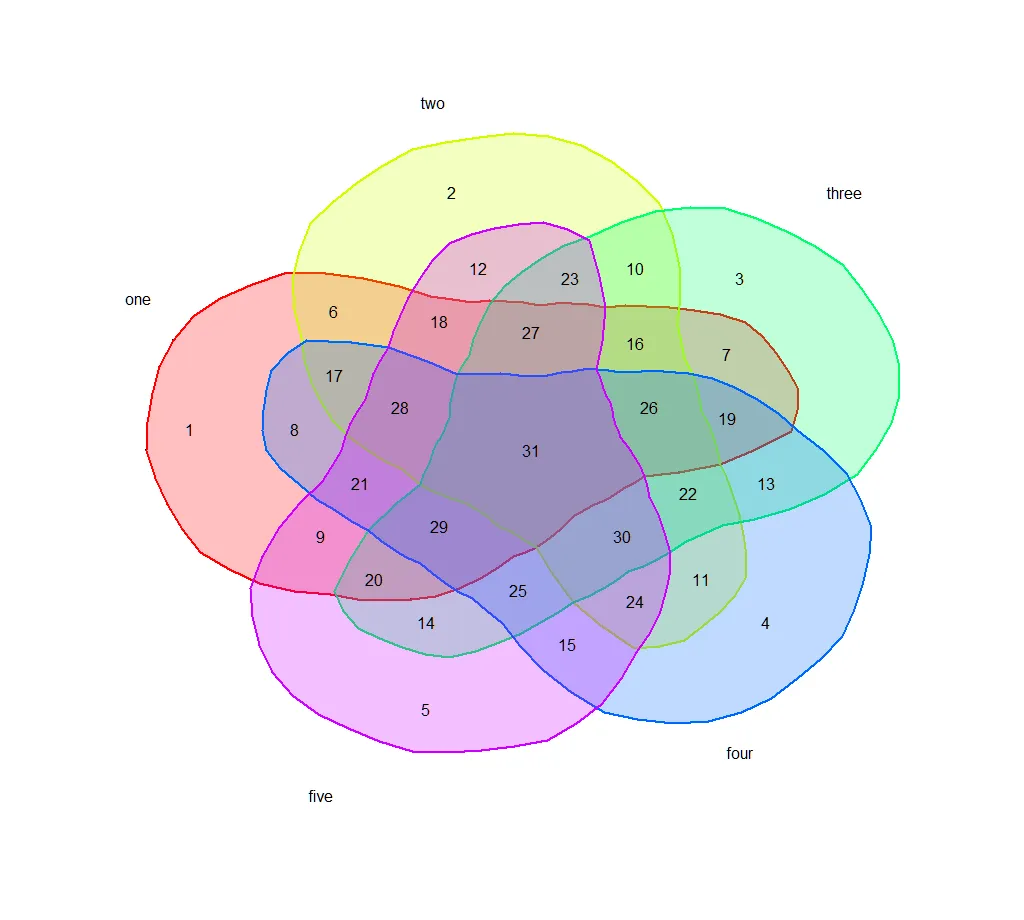
使用上述代码可以生成类似于第一个Venn图。我还没有足够的声望来发布图片。您可能需要减弱颜色并移动单元格名称。
library(venn); library(tidyverse); library(stringr);

p_th = 0.0;

data <- read_csv("finaldf.csv")
data

venn =
  list(A =
     data %>%
     filter(CVA > p_th) %>%
     .$phrase,
   B =
     data %>%
     filter(IHD > p_th) %>%
     .$phrase,
   C =
     data %>%
     filter(CM > p_th) %>%
     .$phrase,
   D =
     data %>%
     filter(ARR > p_th) %>%
     .$phrase,
   E =
     data %>%
     filter(VD > p_th) %>%
     .$phrase,
   G =
     data %>%
     filter(CHD > p_th) %>%
     .$phrase);

png("ven.png", width = 800, height = 800)

venn.result =
  venn(venn, ilabels = TRUE,
       zcolor = "style", size = 25, cexil = 1.2, cexsn = 1.5);


dev.off()
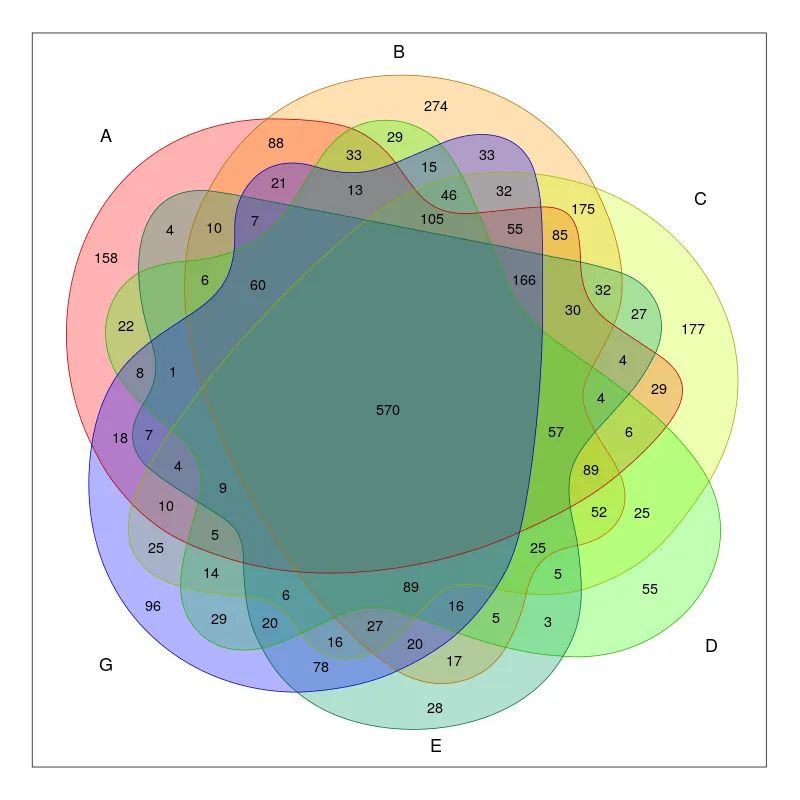
6个集合的维恩图
dput(data) 来使其更有用和可重现性? - Tungfinal_df.csv 文件长什么样? - user2110417