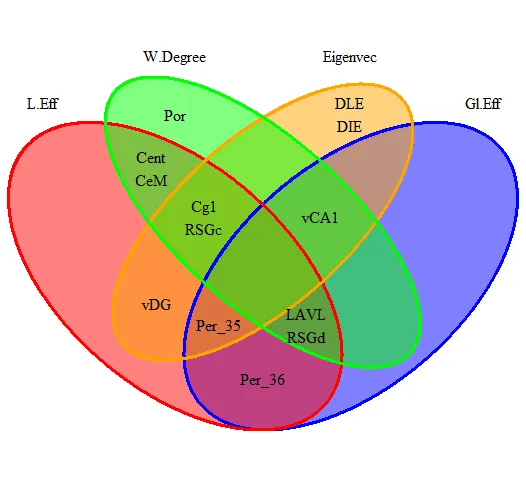
我正在尝试以优化的方式绘制一个Venn图(如下所示),并使用案例作为内部标签(而不是每个交集中的案例数)。 我知道有针对它们的每个帖子,但没有一个解决方案可以让我两者兼得。
我有这个:
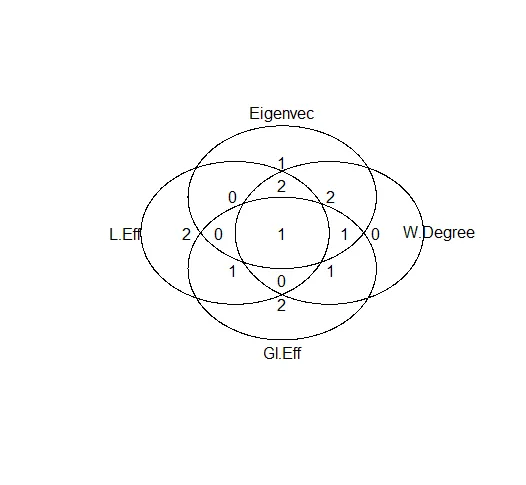
我得到了以下输出:
我有这个:
x <- list()
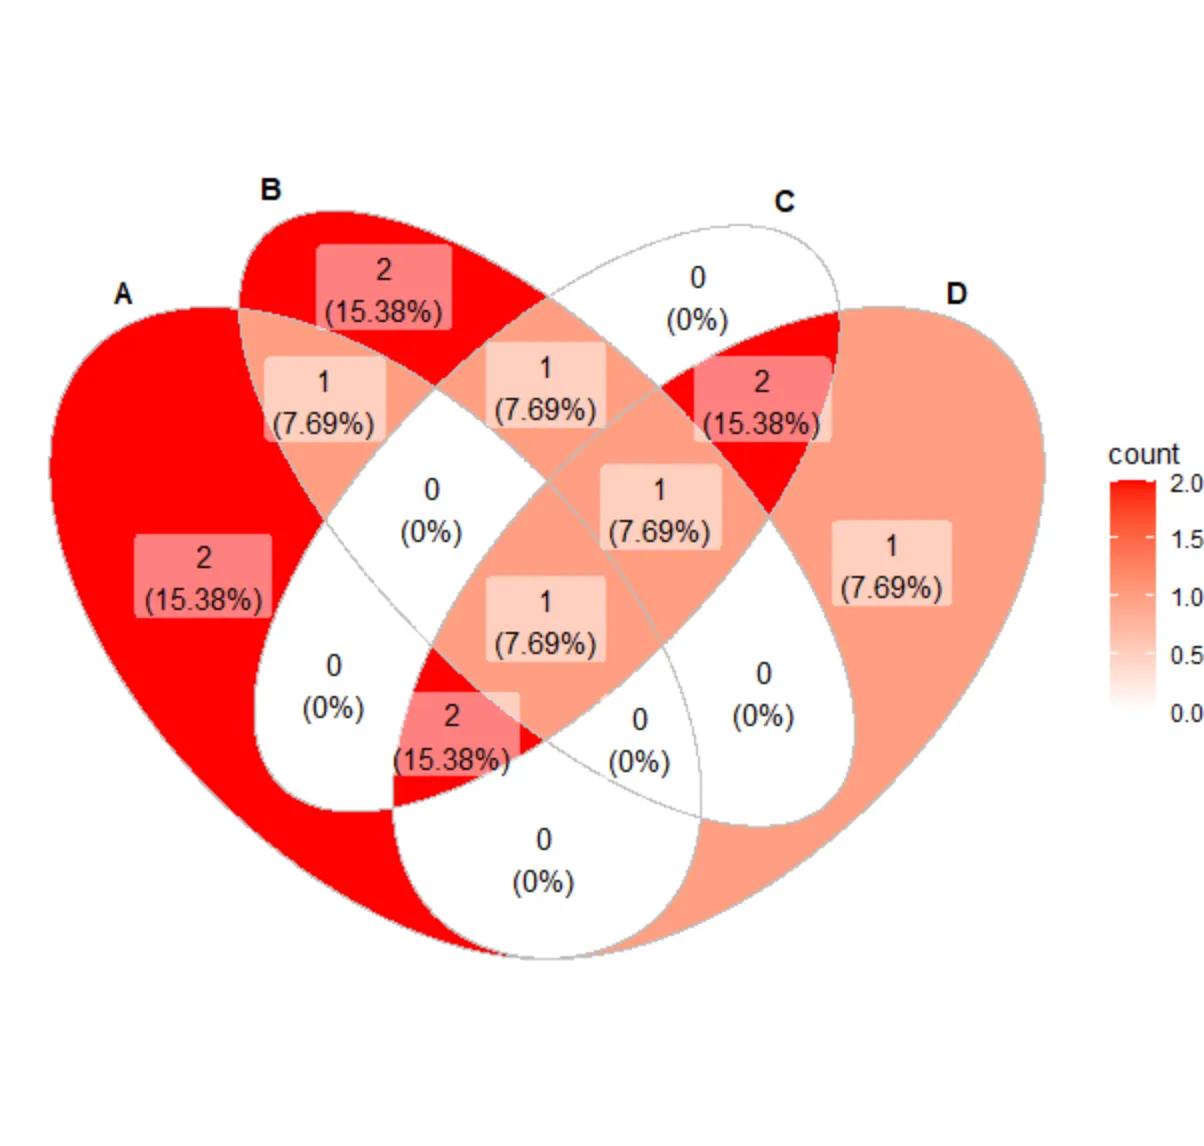
x$A <- as.character(c("Per_36","Cent","CeM","vDG","LAVL","RSGd"))
x$B <- as.character(c("vCA1","DLE","Per_36","vDG","DIE","Per_35"))
x$C <- as.character(c("vCA1","Cg1","LAVL", "RSGc", "RSGd","Per_35","Per_36"))
x$D <- as.character(c("Por","Cg1","RSGc","LAVL","Per_35","RSGd","Per_36"))
require(VennDiagram)
v0 <-venn.diagram(x, lwd = 3, col = c("red", "green", "orange", "blue"),
fill = c("red", "blue", "green", "orange"), apha = 0.5, filename = NULL)
grid.draw(v0)
overlaps <- calculate.overlap(x)
overlaps <- rev(overlaps)
for (i in 1:length(overlaps)){
v0[[i+8]]$label <- paste(overlaps[[i]], collapse = "\n")
}
grid.newpage()
grid.draw(v0)
我得到了以下输出:
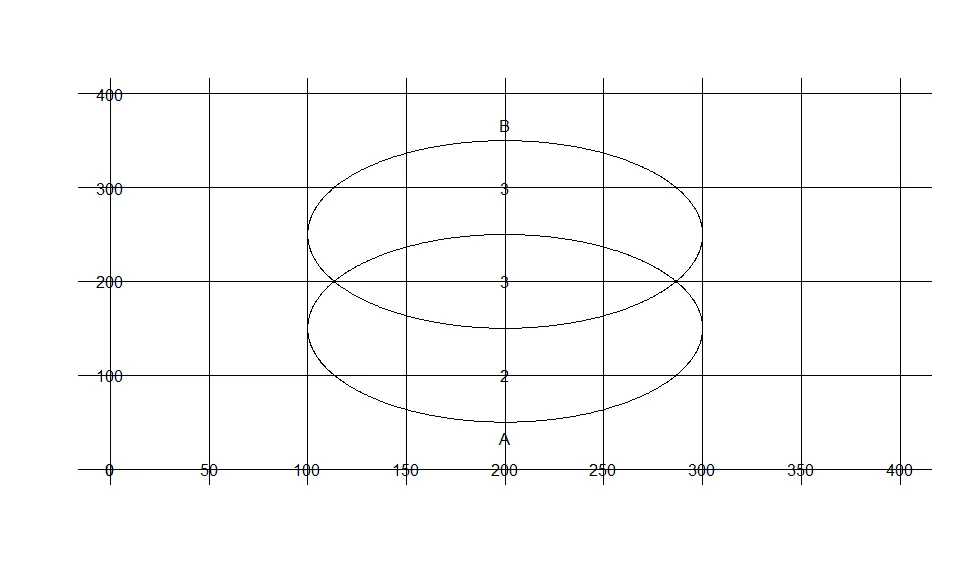
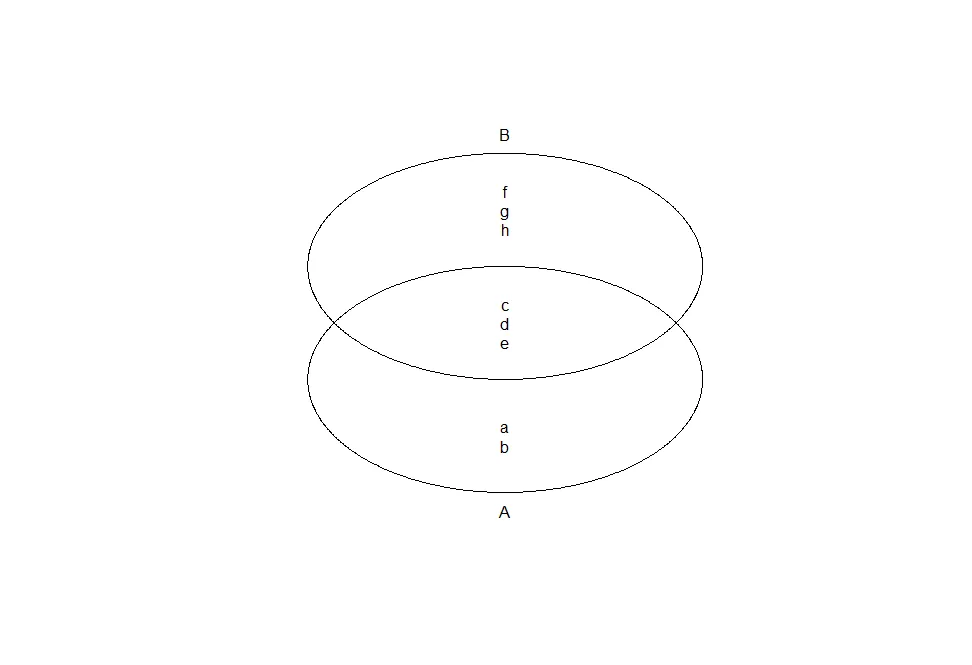
关于Venn图的组织,我想要做到这一点:
c <- venn(x, simplify = TRUE, small = 0.5, intersections = TRUE)
我使用gplots()包中的venn函数,并使用simplify = TRUE参数得到了一个图表。然而,在venn函数中,我似乎无法用标签名称替换计数。我使用了intersections = TRUE参数,根据参数说明应该可以实现替换,但它并没有生效(尽管如果我查看变量c的内部信息,信息确实存在)。
    Logical flag indicating if the returned object should have the attribute
"individuals.in.intersections" featuring for every set a list of individuals
 that are assigned to it.
问题:使用VennDiagram包,是否有一种方法可以像gplots包中的venn函数中的simplify参数一样执行相同的操作?
问题2:使用gplots包中的venn函数,是否有一种方法可以显示每个元素的名称而不是元素计数?就像我在“venn.diagram”函数中所做的那样?
提前致谢,
v0[[i+8]]$label? - Ibo