ggplot2在自定义缩放轴后丢失标签

7
我试图使用ggplot2scales::trans_new()来应用自定义缩放我的x轴。但是,当我这样做时,某些轴标签会丢失。有人能帮我弄清楚原因吗?
设置:
library(tidyverse)

# the data
ds <- tibble(
  myx = c(1, .5, .1, .01, .001, 0),
  myy = 1:6
)

# the custom transformation
forth_root_trans_rev <- scales::trans_new(
  name = "sign_fourth_root_rev",
  transform = function (x) { - abs(x)^(1/4) },
  inverse = function (x) { x^4 }
)

情节1:

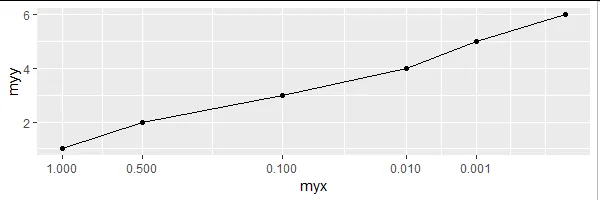
当我试图绘制这个图时,x = 0的标签会丢失。

# plot - missing x-label at `0`
ggplot(ds, aes(x = myx, y = myy)) + 
  geom_line() + 
  geom_point() + 
  scale_x_continuous(
    trans = forth_root_trans_rev,
    breaks = sort(unique(ds$myx)),
  )

绘图2

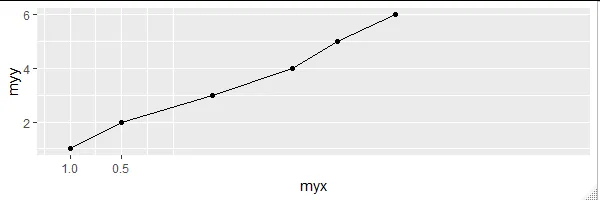
当我在图形两侧添加一些空间时,更多的x轴标签会丢失。

在<code>0</code>处缺少x轴标签

# plot - missing x-labels below 0.5
ggplot(ds, aes(x = myx, y = myy)) + 
  geom_line() + 
  geom_point() +
  scale_x_continuous(
    trans = forth_root_trans_rev,
    breaks = sort(unique(ds$myx)),
    expand = expand_scale(mult = c(.1, .6))
  )

0.5以下的x轴标签缺失

我猜想这与这个旧问题有关:https://github.com/tidyverse/ggplot2/issues/980。然而,我无法弄清如何应用此转换并保留所有x轴标签。

我哪里做错了吗?


1
不确定您的意思... 此调用返回预期值:forth_root_trans_rev$transform(c(-2, 1, 0, 1, 2)) (# [1] -1.189207 -1.000000 0.000000 -1.000000 -1.189207)。虽然对于负数 x 没有意义 - 但是 myx 变量仅包含正值(和零)。 - crlwbm
@Jet使用scale_x_continuous(limits=c(1, 10^-6))对数据进行剪裁,这样在x=0处的点就不会被显示出来了,是吗? - crlwbm
1个回答

5
该问题的原因是两个因素的组合:
1. 经过转换后,您的x轴值落在[-1, 0]范围内,因此任何扩展(无论是加性还是乘性)都会使最终范围覆盖正和负值。
2. 您的自定义转换在[某个负数,某个正数]区域内不是一对一的。
产生原因:在构建ggplot对象时,x轴断点的计算方式如下:
1. 获取转换值的限制(对于问题中的c(1, .5, .1, .01, .001, 0),这将是(-1, 0))。
2. 如果适用,则添加限制的扩展(连续轴的默认扩展为两侧各5%,因此限制变为(-1.05, 0.05))。
3. 对限制应用反转换(在限制上进行x ^ 4运算得到(1.215506, 0.000006))。
4. 在用户输入的断点和限制上应用转换(对于断点,c(1, .5, .1, .01, .001, 0)变为(-1.0000000,..., 0.0000000),但是对于限制,(1.215506, 0.000006)现在变为(-1.05, -0.05),比(-1.05, 0.05)更窄。)
5. 范围之外的断点被删除(由于限制现在停在-0.05处,因此删除了在0处的断点)。
解决方法:您可以使用sign()来修改转换以保留正/负值,从而使转换在整个范围内是一对一的,如Hadley在您链接的GH问题的讨论中建议的那样。例如:
# original
forth_root_trans_rev <- scales::trans_new(
  name = "sign_fourth_root_rev",
  transform = function (x) { - abs(x)^(1/4) },
  inverse = function (x) { x^4 }
)

# new
forth_root_trans_rev2 <- scales::trans_new(
  name = "sign_fourth_root_rev",
  transform = function (x) { -sign(x) * abs(x)^(1/4) },
  inverse = function (x) { -sign(x) * abs(x)^4 }
)

library(dplyr)
library(tidyr)

# comparison of two transformations
# y1 shows a one-to-one mapping in either (-Inf, 0] or [0, Inf) but not both;
# y2 shows a one-to-one mapping in (-Inf, Inf)
data.frame(x = seq(-1, 1, 0.01)) %>%
  mutate(y1 = x %>% forth_root_trans_rev$transform() %>% forth_root_trans_rev$inverse(),
         y2 = x %>% forth_root_trans_rev2$transform() %>% forth_root_trans_rev2$inverse()) %>%
  gather(trans, y, -x) %>%
  ggplot(aes(x, y, colour = trans)) +
  geom_line() +
  geom_vline(xintercept = 0, linetype = "dashed") +
  facet_wrap(~trans)

对比图

使用方法

p <- ggplot(ds, aes(x = myx, y = myy)) + 
  geom_line() + 
  geom_point() + 
  theme(panel.grid.minor = element_blank())

p + 
  scale_x_continuous(
    trans = forth_root_trans_rev2,
    breaks = sort(unique(ds$myx))
  )
p + 
  scale_x_continuous(
    trans = forth_root_trans_rev2,
    breaks = sort(unique(ds$myx)),
    expand = expand_scale(mult = c(.1, .6)) # with different expansion factor, if desired
  )

plots


网页内容由stack overflow 提供, 点击上面的
可以查看英文原文,
原文链接