我有一个包含点的 x,y 分布,通过 scipy.stats.gaussian_kde 得到 KDE。这是我的代码和输出结果(可以从这里获取 x,y 数据):
import numpy as np
from scipy import stats

# Obtain data from file.
data = np.loadtxt('data.dat', unpack=True)
m1, m2 = data[0], data[1]
xmin, xmax = min(m1), max(m1)
ymin, ymax = min(m2), max(m2)

# Perform a kernel density estimate (KDE) on the data
x, y = np.mgrid[xmin:xmax:100j, ymin:ymax:100j]
positions = np.vstack([x.ravel(), y.ravel()])
values = np.vstack([m1, m2])
kernel = stats.gaussian_kde(values)
f = np.reshape(kernel(positions).T, x.shape)

# Define the number that will determine the integration limits
x1, y1 = 2.5, 1.5

# Perform integration?

# Plot the results:
import matplotlib.pyplot as plt
# Set limits
plt.xlim(xmin,xmax)
plt.ylim(ymin,ymax)
# KDE density plot
plt.imshow(np.rot90(f), cmap=plt.cm.gist_earth_r, extent=[xmin, xmax, ymin, ymax])
# Draw contour lines
cset = plt.contour(x,y,f)
plt.clabel(cset, inline=1, fontsize=10)
plt.colorbar()
# Plot point
plt.scatter(x1, y1, c='r', s=35)
plt.show()
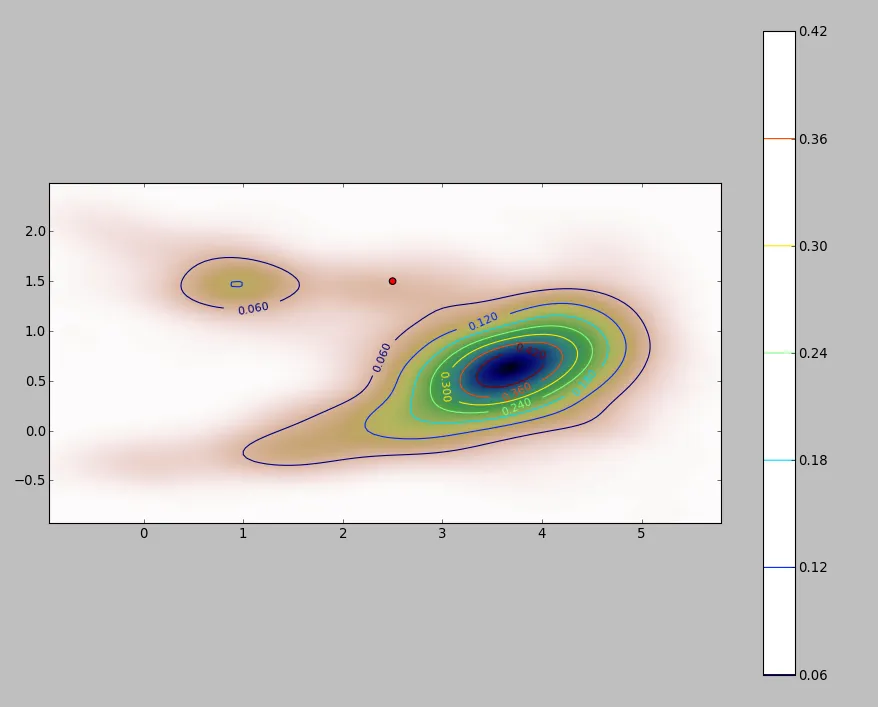
红点的坐标为(x1, y1),与2D图中的每个点一样,它具有由f(核或KDE)给出的相关值,该值介于0和0.42之间。 假设f(x1, y1) = 0.08。
我需要将f与在x和y上的积分限进行积分,这些积分限由那些f评估为小于f(x1, y1)的区域给出,即:f(x, y)<0.08。
据我所见,python可以通过数值积分对函数和一维数组进行积分,但我没有看到任何可以让我对二维数组(f核)进行数值积分的东西。此外,我甚至不确定如何识别给定条件(即:f(x, y)小于某个给定值)给出的区域。
这是否可以完成?