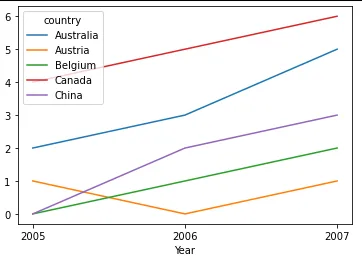
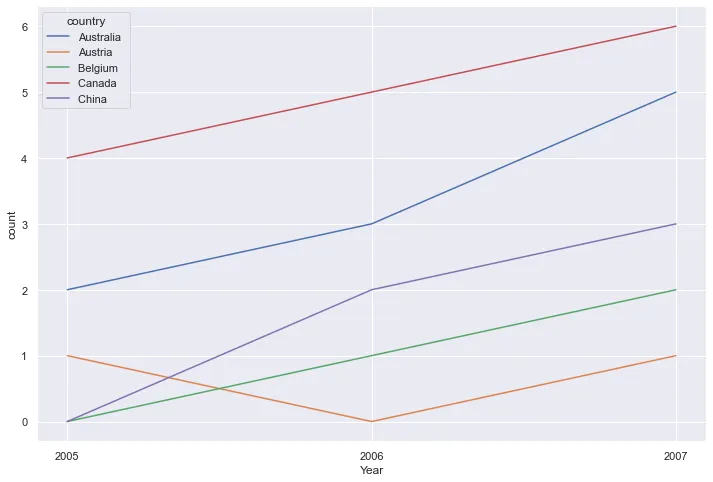
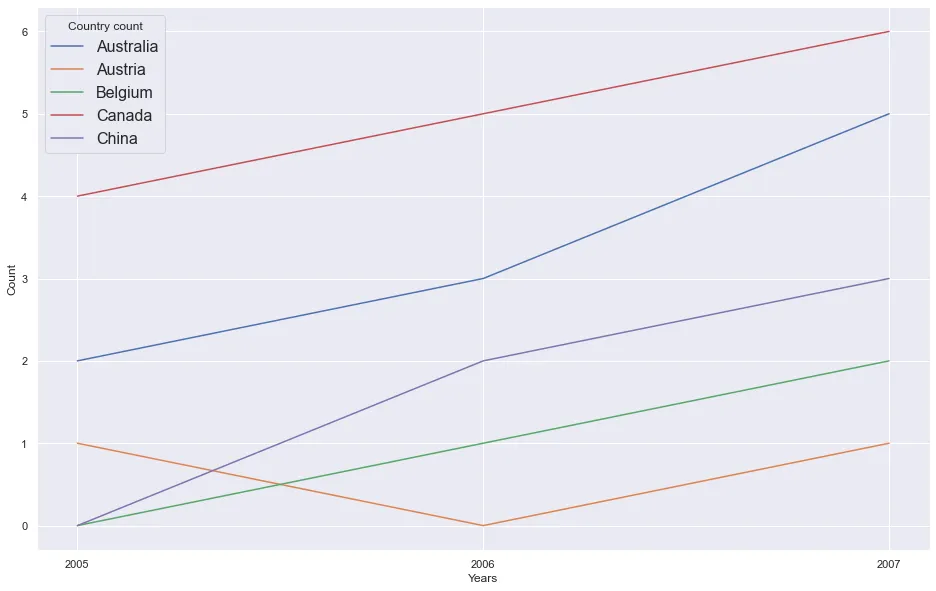
我想把这个数据框绘制成时间序列,每个国家每年根据“计数”增加或减少一条线。我该怎么做?
我希望有类似这样的东西: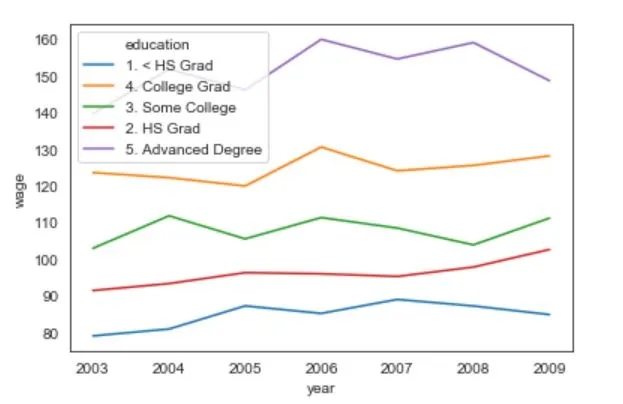
country count
Year
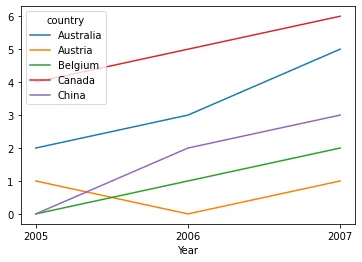
2005 Australia 2
2005 Austria 1
2005 Belgium 0
2005 Canada 4
2005 China 0
2006 Australia 3
2006 Austria 0
2006 Belgium 1
2006 Canada 5
2006 China 2
2007 Australia 5
2007 Austria 1
2007 Belgium 2
2007 Canada 6
2007 China 3
我希望有类似这样的东西:
seaborn的好主意 +1 - T C Molenaar