更新
感谢 @user20650 和 @李哲源 Zheyuan Li,这是我想出的解决方案:
# Example data set: df
# 3600 observations/points
# Create a vector of the cumulative distances between all of the points
require(Momocs)
cumdist <- coo_perimcum(df)
# Apply splines parametrically - define a spline interpolated mapping R --> R^2 of some curve c
# c(t) = (x(t), y(t))
# 't' is the set of cumulative distances (as defined above)
# Set the number of points to some fraction of the number of observations in the data set (5% in this case)
splines <- cbind.data.frame(x = c(spline(cumdist, df[, 1], method = "natural",
n = ceiling(nrow(df)*0.05))$y),
y = c(spline(cumdist, df[, 2], method = "natural",
n = ceiling(nrow(df)*0.05))$y))
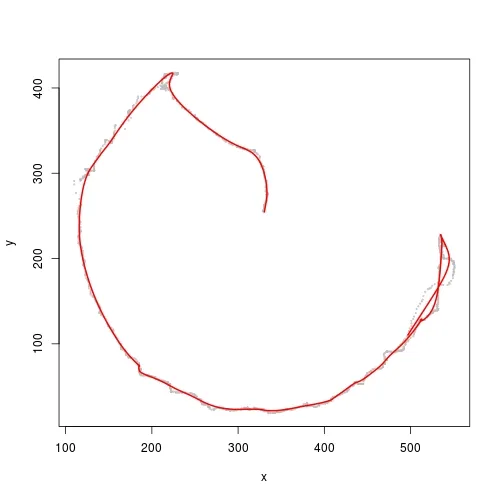
plot(df, col = "gray")
lines(splines, col = "red", lwd = 2)
distance <- function(df, mm) # data frame must be in the form (x,y); mm = pixel to mm conversion factor
{
require(Momocs)
cumdist <- coo_perimcum(df) # calculates the cumulative Euclidean distance between points
splines <- cbind.data.frame(x = c(spline(cumdist, df[, 1], method = "natural",
n = ceiling(nrow(df)*0.05))$y),
y = c(spline(cumdist, df[, 2], method = "natural",
n = ceiling(nrow(df)*0.05))$y))
assemble <- Mod(diff(splines$x+1i*splines$y))*mm
distance <- sum(assemble)/1000 # sum the distances and convert to meters
distance
}
distance(df, 0.444444)
distance(splines, 0.444444)
原始帖子
我正在尝试平滑动物足迹的崎岖路径,以便更准确地确定它们的长度。数据以(x,y)二维坐标的形式呈现。
我手头的示例数据集相当大(3600行),以更好地说明问题的范围。可在此处获取.Rdata文件:
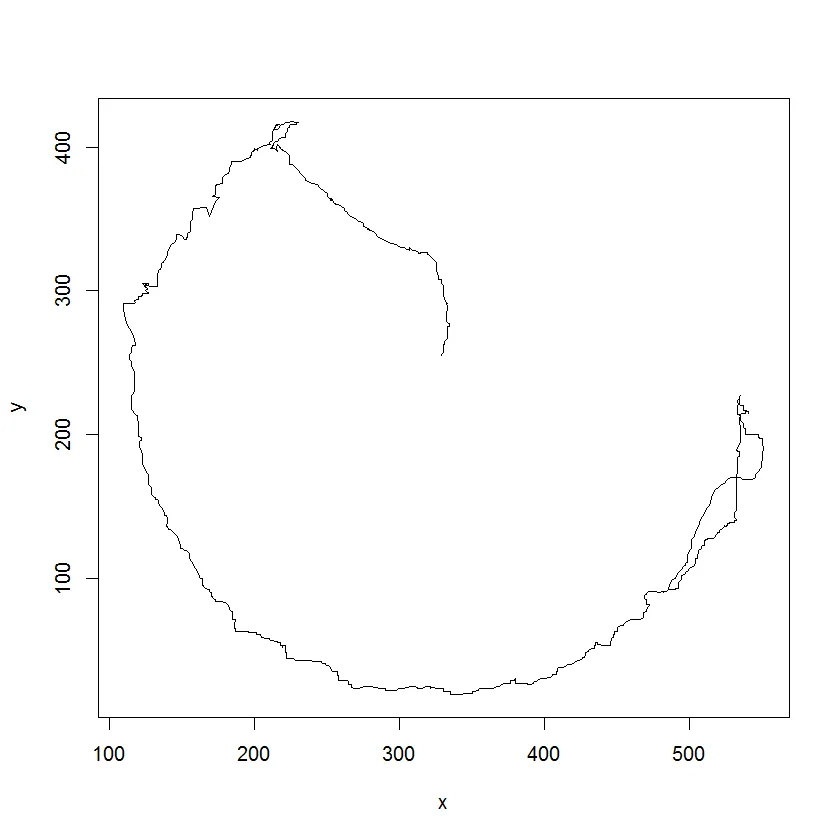
with(df, plot(x,y, type = "l"))
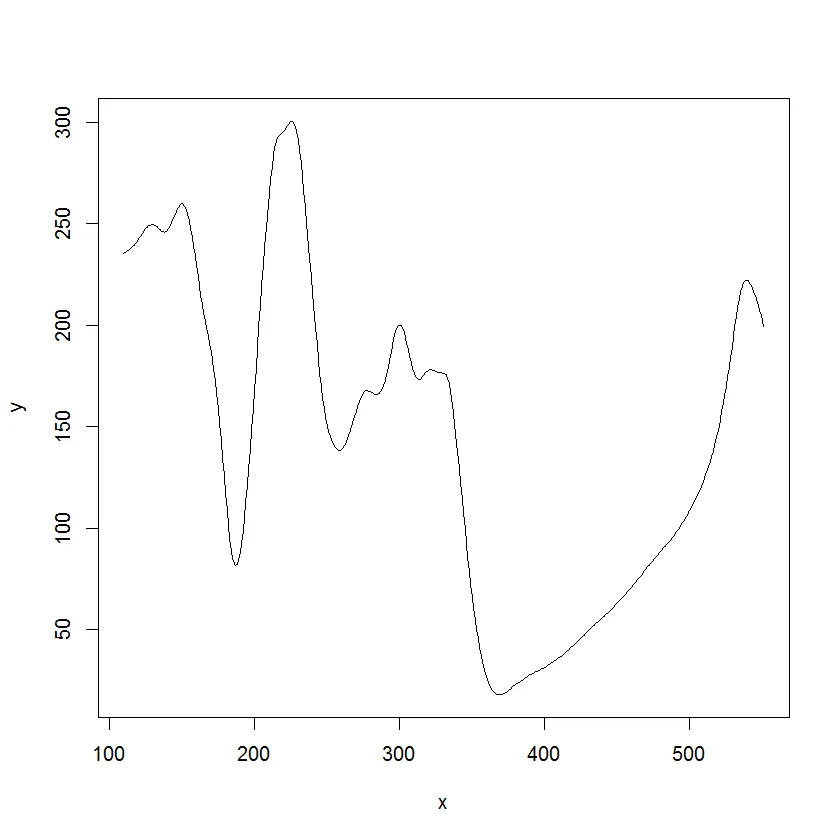
接着,我有了一个想法:将数据分成较小的路径,并对每个列表元素应用smooth.spline()。最终目标是将列表重新整合成连续、平滑的轨迹。
chunks <- list(split(df, (as.numeric(rownames(df))-1) %/% 90))

smooth.tracks <- function(x)
{
  smooth.spline(x, spar = 0.55)
}

df.smooth <- lapply(chunks, smooth.tracks)
由于出现的错误:
Error in xy.coords(x, y) :
  'x' is a list, but does not have components 'x' and 'y
我可能在这里漏掉了非常简单的东西... 有什么想法吗?