确定和存储Voronoi单元格邻接性

5
我将使用数千个点进行工作。我可以实现或使用现有的Fortunes算法实现来生成点的Voronoi图,但我的应用还需要我知道每个Voronoi单元格的邻接关系。
更具体地说,对于任何Voronoi单元格,我需要知道与之相邻的单元格。目前,我不太关心输出或存储方法,因为我很可能会调整一个实现以符合我的要求。
有人知道一种算法,或者更好的是知道一种已实现的算法,可以完成单元格邻接确定吗?我将在Python中进行工作,但任何东西都可以,因为我可以轻松地翻译代码。
谢谢!
4个回答

12

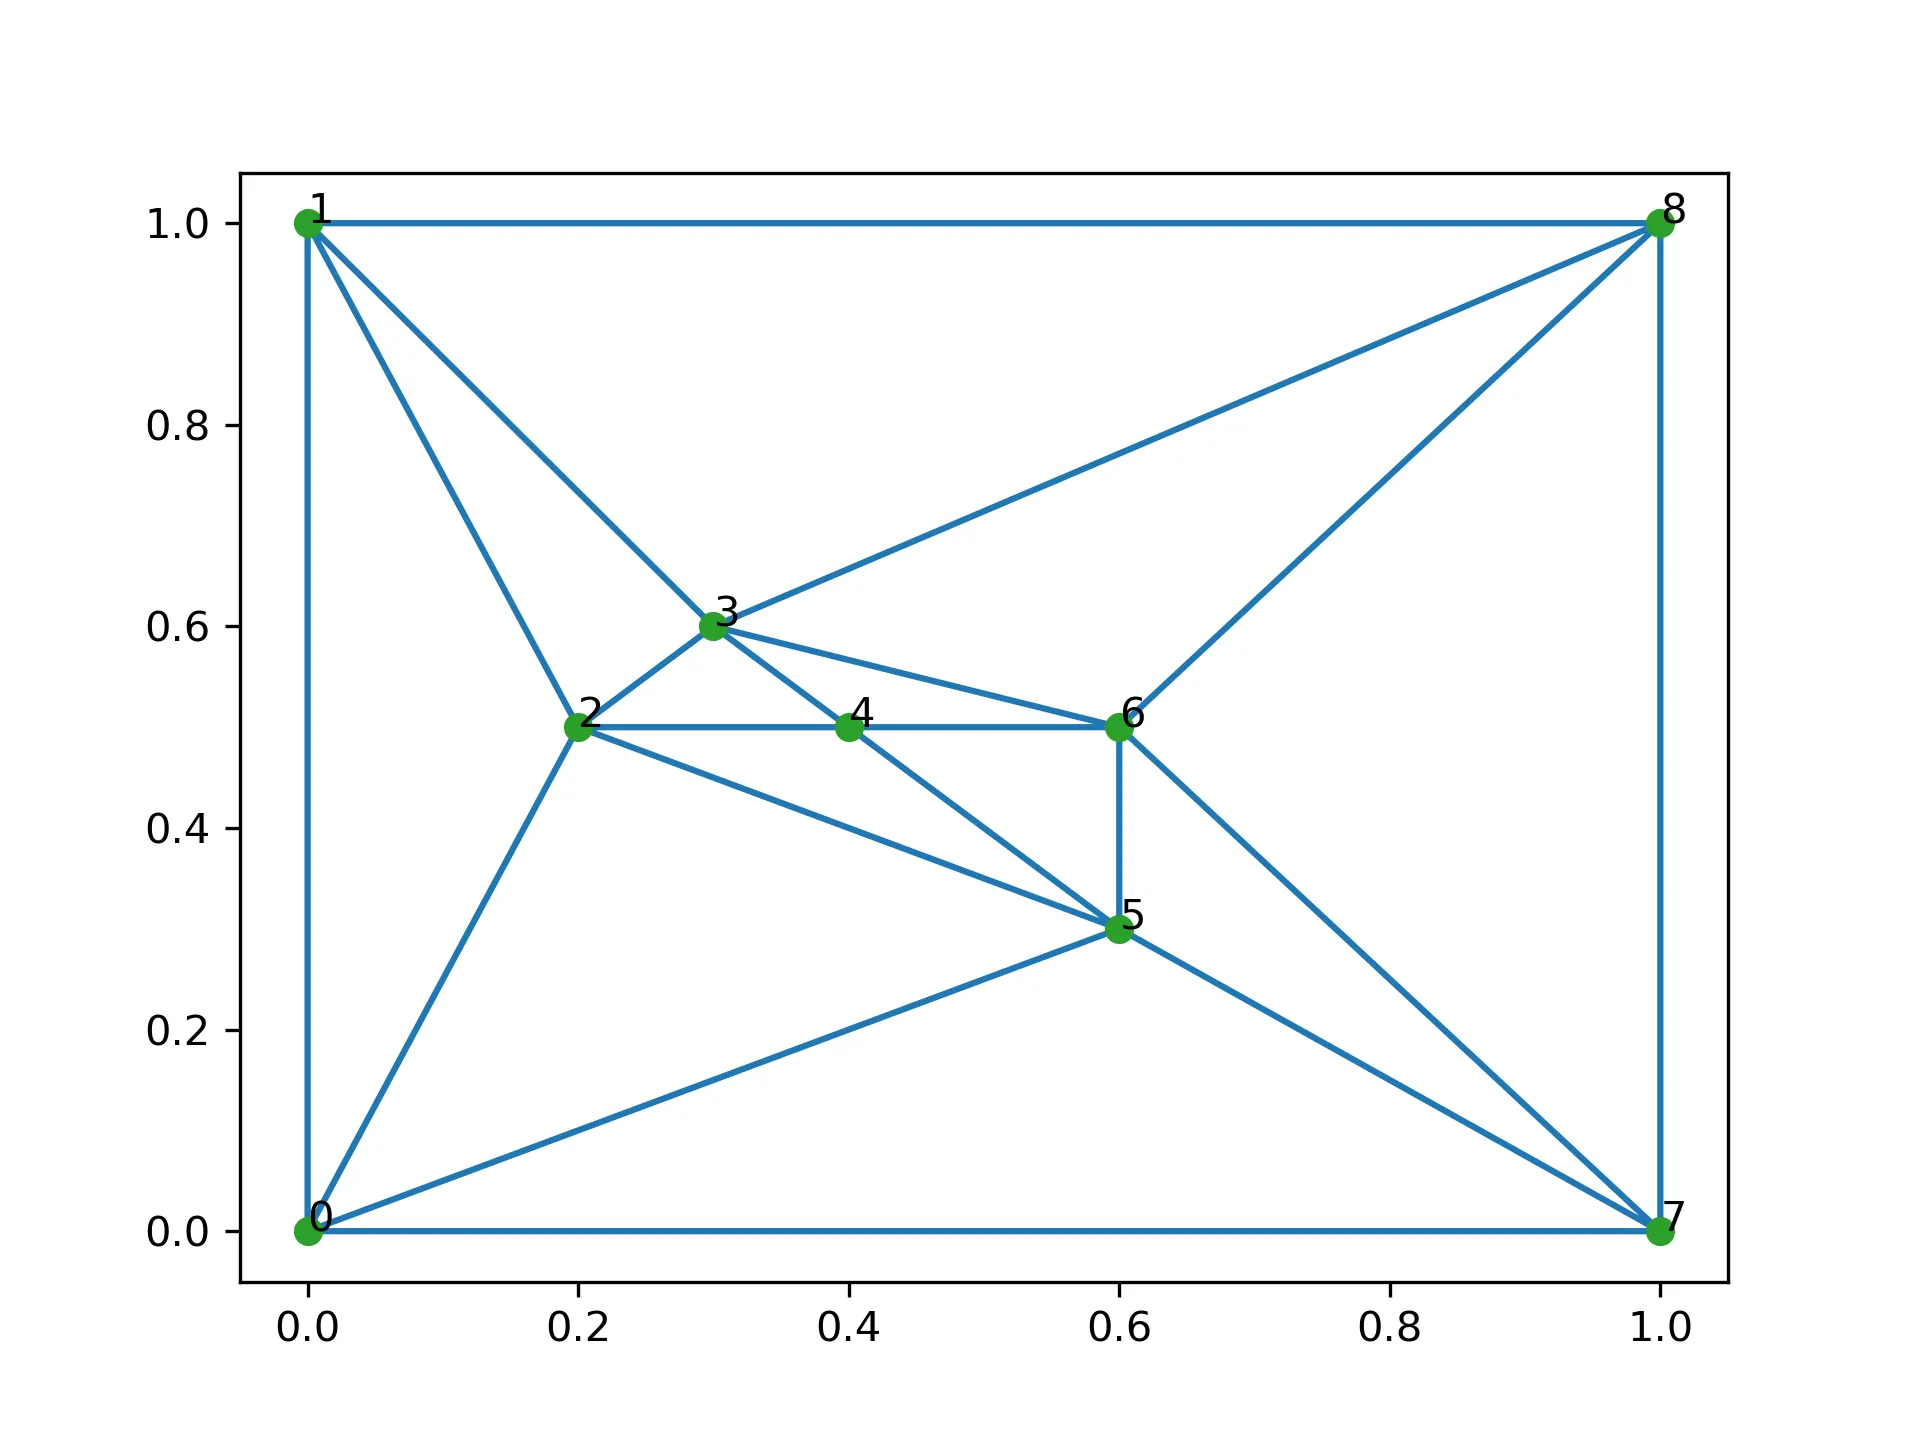
虽然这个问题很老,但我正在寻找同样的答案,并认为该答案可能仍对某些人有帮助。可以使用scipy模块中的Delaunay

from scipy.spatial import Delaunay
from collections import defaultdict
import itertools

points=[[0.0, 0.0], [0.0, 1.0], [0.2, 0.5], [0.3, 0.6], [0.4, 0.5], [0.6, 0.3], [0.6, 0.5], [1.0, 0.0], [1.0, 1.0]]
tri = Delaunay(points)
neiList=defaultdict(set)
for p in tri.vertices:
    for i,j in itertools.combinations(p,2):
        neiList[i].add(j)
        neiList[j].add(i)

for key in sorted(neiList.iterkeys()):
    print("%d:%s" % (key,','.join([str(i) for i in neiList[key]])))

0:1,2,5,7
1:0,8,2,3
2:0,1,3,4,5
3:8,1,2,4,6
4:2,3,5,6
5:0,2,4,6,7
6:8,3,4,5,7
7:8,0,5,6
8:1,3,6,7
   
# This is for visualization
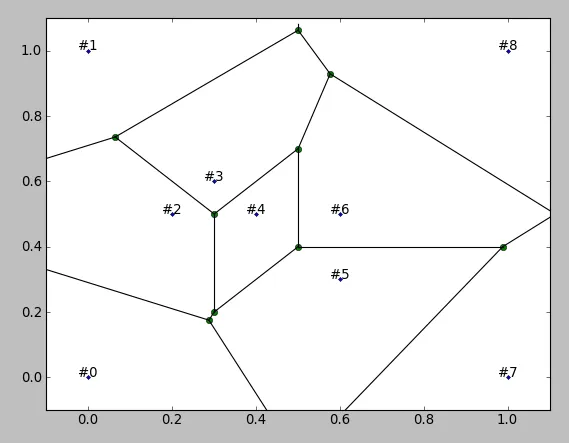
from scipy.spatial import Voronoi, voronoi_plot_2d
import matplotlib.pyplot as plt
vor = Voronoi(points)
voronoi_plot_2d(vor)
for i,p in enumerate(x):
    plt.text(p[0], p[1], '#%d' % i, ha='center')
plt.show()

这里输入图片描述


4
有用的提示。需要强调的是,这个Voronoi图的可视化在边界处可能会误导。例如,节点#0与#1和#7相邻,但是这张图中并没有显示出来。 - Maptopixel
谢谢你的回答。为什么要使用defaultdict?它与常规的{}有什么不同? - Nathan majicvr.com
此处我发布了一个更简单(且更高效)的答案,基于这篇文章。 - Puco4

3

有几种不同的方法可以实现这个。

如果您只能访问沃罗诺伊图,您可以查找单元格之间共享边缘线段。如果您发现两个单元格共享一个沃罗诺伊边缘线段,则意味着它们是相邻的。为了建立整个数据集的邻接信息,一种有效的方法是通过扫描沃罗诺伊单元格列表构建边缘的哈希表。

for (all cells in voronoi diagram)
    for (all edges in current cell)
        if (matching edge found in hash table)
            // the current cell is adjacent to the cell that added
            // the matching edge segment to the hash table
        else
            // push current edge segment onto hash table and mark with 
            // current cell index
        endif
    endfor
endfor

有很多现有的优秀软件包可用于计算点集的Voronoi图/ Delaunay三角剖分。由于这是一个计算成本高、数值敏感的操作,我建议使用现有的库。 TriangleQHull 软件包被广泛使用。

希望这可以帮到你。


1

这里提供了一个可能的算法链接,它使用线性规划方法。

PuLP可以生成MPS或LP文件,并调用GLPK, COIN, CPLEX, 和GUROBI来解决线性问题。

PuLP是一个用Python编写的LP建模器,可以用于在Python中建模此线性程序,然后使用GLPK进行求解。


1

我以一种更加简单的方式重写了@imsc的答案,并且没有使用itertoolsdefaultdict,以防对某些人有所帮助:

import numpy as np
import matplotlib.pyplot as plt
from scipy.spatial import Delaunay

points=np.array([[0.0, 0.0], [0.0, 1.0], [0.2, 0.5], [0.3, 0.6], [0.4, 0.5], [0.6, 0.3], [0.6, 0.5], [1.0, 0.0], [1.0, 1.0]])

indptr_neigh, neighbours = Delaunay(points).vertex_neighbor_vertices

#Accessing the neighbours
for i in range(len(points)):
    i_neigh = neighbours[indptr_neigh[i]:indptr_neigh[i+1]]
    print('i: %d, i_neigh:'  %i, i_neigh)

#Plot
plt.triplot(points[:,0], points[:,1], Delaunay(points).simplices)
plt.plot(points[:,0], points[:,1], 'o')
for i in range(len(points)):
    plt.text(points[i,0], points[i,1], str(i))
plt.savefig('delaunay.png', dpi = 300)

输出:

i: 0, i_neigh: [2 1 7 5]
i: 1, i_neigh: [2 0 3 8]
i: 2, i_neigh: [1 0 3 4 5]
i: 3, i_neigh: [8 1 2 4 6]
i: 4, i_neigh: [3 2 6 5]
i: 5, i_neigh: [7 0 6 4 2]
i: 6, i_neigh: [8 7 3 4 5]
i: 7, i_neigh: [8 6 5 0]
i: 8, i_neigh: [3 1 6 7]

enter image description here

在我的电脑上,这比@imsc的答案快一点。


网页内容由stack overflow 提供, 点击上面的
可以查看英文原文,
原文链接