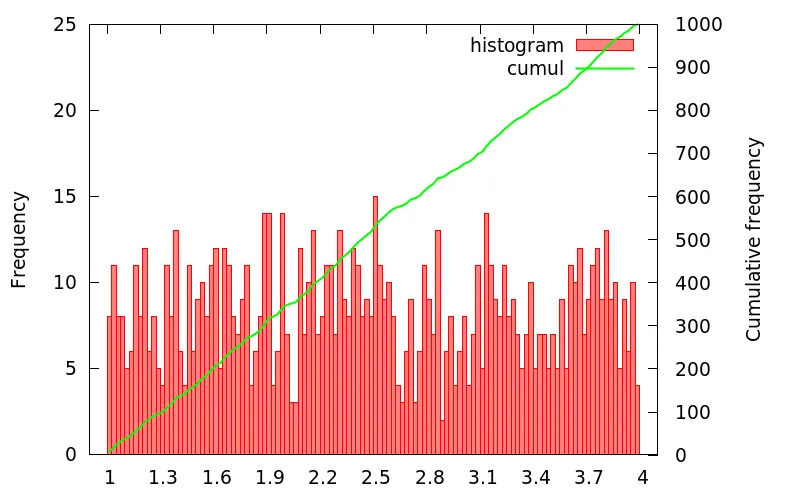
我制作了一个简单的累积和直方图图表,展示了n=1000个实数的均匀随机分布:
http://www.filedropper.com/random1_1:random1.dat
以下是宏代码:
unset key
clear
reset


n=120 #number of intervals
max=4. #max value
min=1. #min value

width=(max-min)/n #interval width
#function used to map a value to the intervals
bin(x,width)=width*floor(x/width)+width/2.0 # cosi viene centrato in mezzo
set xtics min,(max-min)/10,max
set boxwidth width
set style fill solid 0.5 border


set ylabel 'Frequency'
set y2label 'Cumulative frequency'
set y2tics 0,100,1000
set ytics nomirror

set xrange [0.9:4.1]
set yrange [0:25]

set terminal pngcairo size 800,500 enhanced font 'Verdana,14'
set output "testCum.png"

plot 'random1.dat' using (bin($1,width)):(1.0) smooth frequency with boxes title 'histogram',\
'' using (bin($1,width)):(1.0) smooth cumulative axis x1y2 w l lt 2 lw 2 lc rgb 'green' title 'cumul'
现在的output.png如下:
我如何告诉Gnuplot,我不仅想要累积图,还想从中导出数据到特定的file.dat文件中?