我的目标是画一个有4个象限的图形,并在其中绘制点。另外,我怎么样才能将一个象限分成几个部分?我该如何在matplotlib中实现相同的功能:绘制一个有4个象限的图/曲线。其中x轴为(1-9),y轴为(1-9)?
我该如何使用Python matplotlib绘制具有4个象限的图形或图表?
3
- siddarthforever
1
3这里的答案并不是太有用。请查看这个和文档链接。 - ImportanceOfBeingErnest
3个回答
4
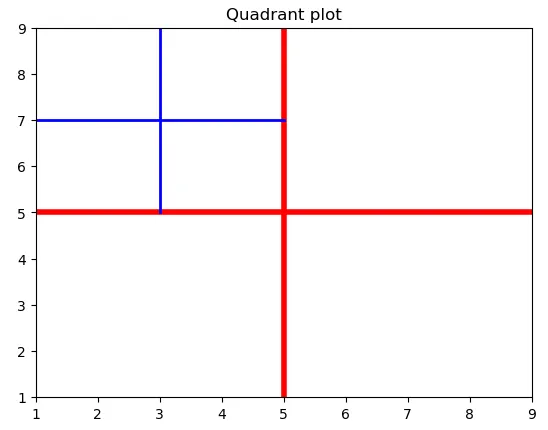
从问题描述来看,您想要一个带有特定xy范围的多个区域的单一图表,这很容易实现。您可以在图表上绘制线条以划分感兴趣的区域。以下是基于您所述目标的快速示例:
import matplotlib.pyplot as plt

plt.figure()
# Set x-axis range
plt.xlim((1,9))
# Set y-axis range
plt.ylim((1,9))
# Draw lines to split quadrants
plt.plot([5,5],[1,9], linewidth=4, color='red' )
plt.plot([1,9],[5,5], linewidth=4, color='red' )
plt.title('Quadrant plot')
# Draw some sub-regions in upper left quadrant
plt.plot([3,3],[5,9], linewidth=2, color='blue')
plt.plot([1,5],[7,7], linewidth=2, color='blue')
plt.show()
- T3am5hark
2
不幸的是,在较新版本的matplotlib上,这不再有效。 - Gabriel Caldas
是的,我认为hold('on')现在已经过时了,但其他所有功能仍然可用。答案已相应更新。 - T3am5hark
1
我会看一下
AxesGrid 工具包:
http://matplotlib.sourceforge.net/mpl_toolkits/axes_grid/index.html
也许这个页面顶部中间的图片是你正在寻找的内容之一。在API文档的下一页中有一些示例,应该是一个很好的起点:http://matplotlib.sourceforge.net/mpl_toolkits/axes_grid/users/overview.html
没有你想要做什么的具体示例,很难给出最好的建议。
- JoshAdel
0
你需要使用subplot,可以参考以下示例:
http://matplotlib.sourceforge.net/examples/pylab_examples/subplot_toolbar.html
- Andrea Zonca
1
更好的理解需要一个例子。 - Andrea Zonca
网页内容由stack overflow 提供, 点击上面的可以查看英文原文,
原文链接
原文链接