我有一个值列表,其中的值在0和1之间交替出现,例如[0,1,0,1,0],我想使用Python的matplotlib将它们绘制成正弦波形式。目前我的代码如下:
input_amp = [1,0,1,0,1,0,1,0,1,0]
plt.plot(input_amp, marker='d', color='blue')
plt.title("Waveform")
plt.ylabel('Amplitude')
plt.xlabel("Time")
plt.savefig("waveform.png")
plt.show()
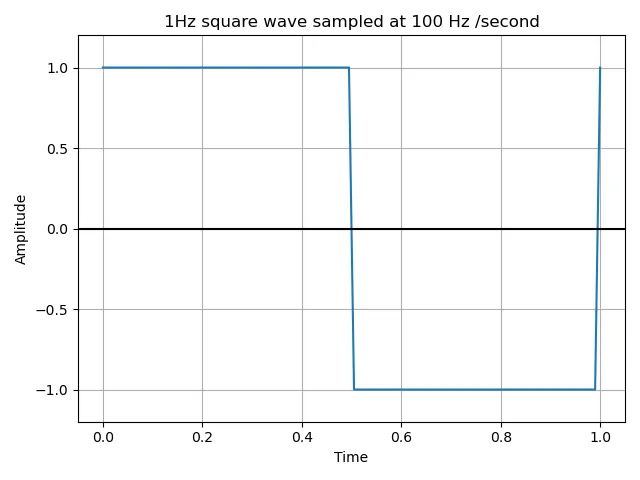
这将给我一个类似这样的输出
 :
如何使线条保持平直,而不是在点之间呈角度?
:
如何使线条保持平直,而不是在点之间呈角度?我找到了这篇文章,但它更多地涉及动画而不仅仅是绘制函数。