有没有人有绘制椭球体的示例代码?在matplotlib网站上有一个绘制球体的示例代码,但没有绘制椭球体的。我正在尝试绘制。
x**2 + 2*y**2 + 2*z**2 = c
其中c是一个常数(比如10),用于定义椭球体形状。我尝试了使用meshgrid(x,y),重构了方程使得z在一侧,但是sqrt成为一个问题。 matplotlib中的球体示例使用角度u,v,但我不确定如何将其应用于椭球体。
有没有人有绘制椭球体的示例代码?在matplotlib网站上有一个绘制球体的示例代码,但没有绘制椭球体的。我正在尝试绘制。
x**2 + 2*y**2 + 2*z**2 = c
其中c是一个常数(比如10),用于定义椭球体形状。我尝试了使用meshgrid(x,y),重构了方程使得z在一侧,但是sqrt成为一个问题。 matplotlib中的球体示例使用角度u,v,但我不确定如何将其应用于椭球体。
以下是如何通过球坐标系完成此操作:
# from mpl_toolkits.mplot3d import Axes3D  # Not needed with Matplotlib 3.6.3
import matplotlib.pyplot as plt
import numpy as np

fig = plt.figure(figsize=plt.figaspect(1))  # Square figure
ax = fig.add_subplot(111, projection='3d')

coefs = (1, 2, 2)  # Coefficients in a0/c x**2 + a1/c y**2 + a2/c z**2 = 1
# Radii corresponding to the coefficients:
rx, ry, rz = 1/np.sqrt(coefs)

# Set of all spherical angles:
u = np.linspace(0, 2 * np.pi, 100)
v = np.linspace(0, np.pi, 100)

# Cartesian coordinates that correspond to the spherical angles:
# (this is the equation of an ellipsoid):
x = rx * np.outer(np.cos(u), np.sin(v))
y = ry * np.outer(np.sin(u), np.sin(v))
z = rz * np.outer(np.ones_like(u), np.cos(v))

# Plot:
ax.plot_surface(x, y, z,  rstride=4, cstride=4, color='b')

# Adjustment of the axes, so that they all have the same span:
max_radius = max(rx, ry, rz)
for axis in 'xyz':
    getattr(ax, 'set_{}lim'.format(axis))((-max_radius, max_radius))

plt.show()
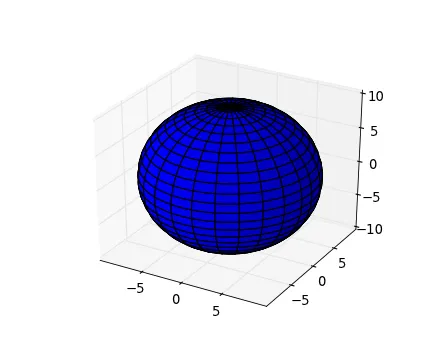
上述程序实际上生成了一个外观更好的“正方形”图形。
这个解决方案受到Matplotlib画廊中示例的强烈启发。
rx, ry, rz = a, b, c 进行赋值(不需要系数 coefs)。 - Eric O. Lebigotnp.outer如何工作的人,可以使用以下代码替代:u = np.linspace(0, 2 * np.pi, 100); v = np.linspace(0, np.pi, 100); u,v = np.meshgrid(u,v,indexing='ij'); x = rx * np.cos(u) * np.sin(v); y = ry * np.sin(u) * np.sin(v); z = rz * np.cos(v)。 - mhdadk在 EOL 的回答基础上进行拓展。有时你会遇到以矩阵格式表示的椭球体:
A 和 c,其中 A 是椭球体的矩阵,而 c 则是代表椭球体中心的向量。
import numpy as np
import numpy.linalg as linalg
import matplotlib.pyplot as plt
from mpl_toolkits.mplot3d import Axes3D

# your ellispsoid and center in matrix form
A = np.array([[1,0,0],[0,2,0],[0,0,2]])
center = [0,0,0]

# find the rotation matrix and radii of the axes
U, s, rotation = linalg.svd(A)
radii = 1.0/np.sqrt(s)

# now carry on with EOL's answer
u = np.linspace(0.0, 2.0 * np.pi, 100)
v = np.linspace(0.0, np.pi, 100)
x = radii[0] * np.outer(np.cos(u), np.sin(v))
y = radii[1] * np.outer(np.sin(u), np.sin(v))
z = radii[2] * np.outer(np.ones_like(u), np.cos(v))
for i in range(len(x)):
    for j in range(len(x)):
        [x[i,j],y[i,j],z[i,j]] = np.dot([x[i,j],y[i,j],z[i,j]], rotation) + center

# plot
fig = plt.figure()
ax = fig.add_subplot(111, projection='3d')
ax.plot_wireframe(x, y, z,  rstride=4, cstride=4, color='b', alpha=0.2)
plt.show()
plt.close(fig)
del fig
所以,这里没有太多新东西,但如果您有一个矩阵形式的椭球体,它被旋转并且可能不位于 0,0,0 的中心位置,并且想要绘制它,那么这个信息是有帮助的。
u = np.linspace(0, 2 * np.pi, 100)
v = np.linspace(0, np.pi, 100)
x = np.outer(np.cos(u), np.sin(v))
y = np.outer(np.sin(u), np.sin(v))
z = np.outer(np.ones_like(u), np.cos(v))
sphere = np.stack((x, y, z), axis=-1)[..., None]
e, v = np.linalg.eig(cov)
s = v @ np.diag(np.sqrt(e)) @ v.T
ellipsoid = (s @ sphere).squeeze(-1) + bias
ax.plot_surface(*ellipsoid.transpose(2, 0, 1), rstride=4, cstride=4, color='b', alpha=0.75)
供参考,u,v 的形状为(100,),这使得x,y,z 成为(100, 100)的数组。sphere 是(100, 100, 3, 1),就广播运算符@而言,它是一个100x100的3x1向量数组。s @ sphere具有相同的大小,因此挤压掉最后一个单位轴使其适合与bias进行广播加法。最后,ellipsoid.transpose(2, 0, 1)的形状为(3, 100, 100),可以将其作为x、y和z值的三个单独数组扩展到plot_surface的调用中。