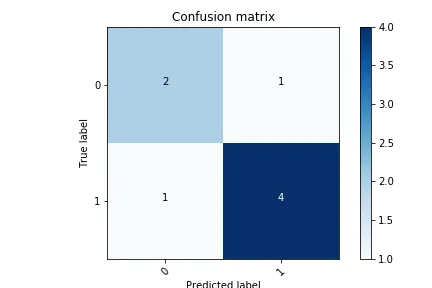
sklearn:绘制跨训练集和测试集的混淆矩阵

3

我有一个关于混淆矩阵的问题。

按照混淆矩阵的定义,它用于评估分类器输出的质量。

当您将数据拆分为训练、测试和验证集时,每个训练和测试都会给出不同的混淆矩阵。如果我想将它们加在一起,应该怎么做?

请考虑以下代码片段:

X, Y = np.array(data[features]), np.array(data['target'])
logo = LeaveOneGroupOut()
group = data['id'].values    
k_fold = KFold(n_splits=5)

scores =[]
per_person_true_y = []
per_person_pred_y = []

classifier_logistic = LogisticRegression()
    for train, test in logo.split(X, Y, group):
        x_train, x_test = X[train], X[test]
        y_train, y_test = Y[train], Y[test]
        classifier_logistic.fit(x_train, y_train.ravel())
        y_predict = classifier_logistic.predict(x_test)
        scores.append(metrics.accuracy_score(y_test,classifier_logistic.predict(x_test)))  
        per_person_true_y.append(y_test)
        per_person_pred_y.append(y_predict)


plot.confusion_matrix( np.array(per_person_true_y),np.array(per_person_pred_y))
plt.show()

这使我出现了以下错误:
TypeError: unhashable type: 'numpy.ndarray'

感谢您的评论。
1个回答

6

目前:您有4个NumPy数组:y_testy_trainy_test_predy_train_pred

您需要:2个NumPy数组y_truey_pred

您可以使用np.concatenate将训练集+测试集组合起来。例如:

y_test = np.array([0, 1, 0, 1])
y_train = np.array([0, 0, 1, 1])

y_test_pred = np.array([1, 1, 0, 1])  # from classifier_logistic.predict(x_test)
y_train_pred = np.array([0, 1, 0, 1]) # from classifier_logistic.predict(x_train)

y_true = np.concatenate((y_train, y_test))  # you already have this as `Y`
y_pred = np.concatenate((y_train_pred, y_test_pred))

我在sklearn文档中找到了一个非常好的混淆矩阵绘制示例

以下是考虑到你的情况的一个示例:

import itertools
import matplotlib.pyplot as plt
import numpy as np
from sklearn.metrics import confusion_matrix

# Source: http://scikit-learn.org/stable/auto_examples/model_selection/
#         plot_confusion_matrix.html#confusion-matrix


y_test = np.array([1, 1, 0, 1])
y_train = np.array([0, 0, 1, 1])

y_test_pred = np.array([1, 1, 0, 1])  # from classifier_logistic.predict(x_test)
y_train_pred = np.array([0, 1, 0, 1]) # from classifier_logistic.predict(x_train)

y_true = np.concatenate((y_train, y_test))
y_pred = np.concatenate((y_train_pred, y_test_pred))

def plot_confusion_matrix(cm, classes,
                          normalize=False,
                          title='Confusion matrix',
                          cmap=plt.cm.Blues):
    """
    This function prints and plots the confusion matrix.
    Normalization can be applied by setting `normalize=True`.
    """
    if normalize:
        cm = cm.astype('float') / cm.sum(axis=1)[:, np.newaxis]
        print("Normalized confusion matrix")
    else:
        print('Confusion matrix, without normalization')

    print(cm)

    plt.imshow(cm, interpolation='nearest', cmap=cmap)
    plt.title(title)
    plt.colorbar()
    tick_marks = np.arange(len(classes))
    plt.xticks(tick_marks, classes, rotation=45)
    plt.yticks(tick_marks, classes)

    fmt = '.2f' if normalize else 'd'
    thresh = cm.max() / 2.
    for i, j in itertools.product(range(cm.shape[0]), range(cm.shape[1])):
        plt.text(j, i, format(cm[i, j], fmt),
                 horizontalalignment="center",
                 color="white" if cm[i, j] > thresh else "black")

    plt.tight_layout()
    plt.ylabel('True label')
    plt.xlabel('Predicted label')

cm = confusion_matrix(y_true, y_pred)
np.set_printoptions(precision=2)

plt.figure()
plot_confusion_matrix(cm, classes=[0, 1],
                      title='Confusion matrix')

enter image description here


顺便问一下,有没有办法完全删除右侧的颜色条? - gented

网页内容由stack overflow 提供, 点击上面的
可以查看英文原文,
原文链接