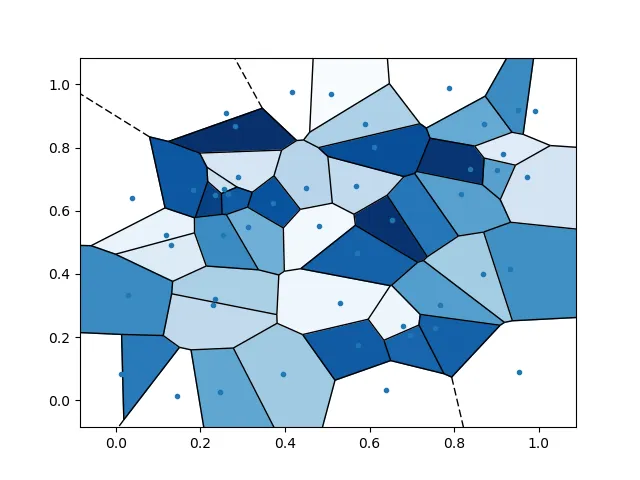
是否可以为 scipy.spatial.Voronoi 图形上色呢?答案是肯定的。
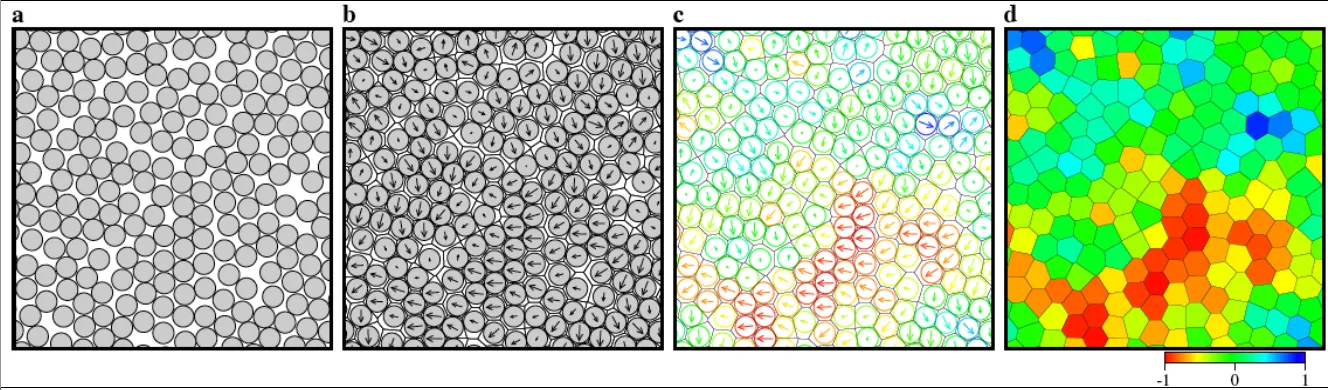
现在我的目标是根据一个颜色比例尺来为每个单元格上色,以表示一种物理量。如下图(PRL 107, 155704 (2011))所示:
我还想知道是否可以计算每个单元格的面积,因为这是我想要计算的一项数据。
实际上你提供的链接提供了给Voronoi图形上色所需的代码。为了将每个单元格分配一个代表物理量的颜色,需要使用在matplotlib中将值映射到颜色中所示方法将该物理量的值映射到归一化的颜色映射。
例如,如果我想将每个单元格分配一个对应于'速度'数量的颜色:
import numpy as np
import matplotlib as mpl
import matplotlib.cm as cm
import matplotlib.pyplot as plt
from scipy.spatial import Voronoi, voronoi_plot_2d

# generate data/speed values
points = np.random.uniform(size=[50, 2])
speed = np.random.uniform(low=0.0, high=5.0, size=50)

# generate Voronoi tessellation
vor = Voronoi(points)

# find min/max values for normalization
minima = min(speed)
maxima = max(speed)

# normalize chosen colormap
norm = mpl.colors.Normalize(vmin=minima, vmax=maxima, clip=True)
mapper = cm.ScalarMappable(norm=norm, cmap=cm.Blues_r)

# plot Voronoi diagram, and fill finite regions with color mapped from speed value
voronoi_plot_2d(vor, show_points=True, show_vertices=False, s=1)
for r in range(len(vor.point_region)):
    region = vor.regions[vor.point_region[r]]
    if not -1 in region:
        polygon = [vor.vertices[i] for i in region]
        plt.fill(*zip(*polygon), color=mapper.to_rgba(speed[r]))
plt.show()
 )
)
scipy.spatial.Voronoi允许您访问每个单元格的顶点,您可以对其进行排序并应用鞋带公式。我没有测试足够的输出来知道由 Voronoi 算法给出的顶点是否已经被排序。但如果没有排序,您可以使用点积来获取每个顶点到某个参考向量的向量之间的角度,然后使用这些角度来排序顶点:
# ordering vertices
x_plus = np.array([1, 0]) # unit vector in i direction to measure angles from
    theta = np.zeros(len(vertices))
    for v_i in range(len(vertices)):
        ri = vertices[v_i]
        if ri[1]-self.r[1] >= 0: # angle from 0 to pi
            cosine = np.dot(ri-self.r, x_plus)/np.linalg.norm(ri-self.r)
            theta[v_i] = np.arccos(cosine)
        else: # angle from pi to 2pi
            cosine = np.dot(ri-self.r, x_plus)/np.linalg.norm(ri-self.r)
            theta[v_i] = 2*np.pi - np.arccos(cosine)

    order = np.argsort(theta) # returns array of indices that give sorted order of theta
    vertices_ordered = np.zeros(vertices.shape)
    for o_i in range(len(order)):
        vertices_ordered[o_i] = vertices[order[o_i]]

# compute the area of cell using ordered vertices (shoelace formula)
partial_sum = 0
for i in range(len(vertices_ordered)-1):
    partial_sum += vertices_ordered[i,0]*vertices_ordered[i+1,1] - vertices_ordered[i+1,0]*vertices_ordered[i,1]
    partial_sum += vertices_ordered[-1,0]*vertices_ordered[0,1] - vertices_ordered[0,0]*vertices_ordered[-1,1]
area = 0.5 * abs(partial_sum)