使用Pandas和Matplotlib绘制groupby图表

3

我是新手,对于Pandas不是很熟悉,如果这个问题太简单或者不太有意义,请见谅。

假设我有以下数据框(源自文档):

import numpy as np
import pandas as pd
import matplotlib.pyplot as plt

df = pd.DataFrame({
        'A' : ['foo', 'bar', 'foo', 'bar', 'foo', 'bar', 'foo', 'foo'],
        'B' : ['one', 'one', 'two', 'three', 'two', 'two', 'one', 'three'],
        'C' : np.random.randn(8),
        'D' : np.random.randn(8)}
)

值:

     A      B         C         D
0  foo    one -1.591757  0.016910
1  bar    one  0.540010  1.022113
2  foo    two -1.134974 -1.600034
3  bar  three  0.082130 -0.221179
4  foo    two  0.252851  1.963539
5  bar    two -3.012450  0.815712
6  foo    one -0.243863  0.615665
7  foo  three -2.558635 -2.405591

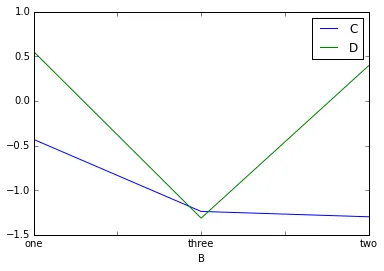
我会针对B列的任何值计算C和D列的平均值:

result = df.groupby("B").mean()

数值:

              C         D
B                        
one   -0.431870  0.551563
three -1.238253 -1.313385
two   -1.298191  0.393072 

我可以使用DataFrameplot方法绘制结果表:

result.plot()

数据帧绘图方法

现在,如果我想进一步操作绘图,并直接使用plt.plot,那么图例将会消失,横轴标签则被替换为数字索引:

plt.plot(result)

plt.plot方法的图表

如何使用plt.plot方法获得相同的图表?


你使用的是哪个版本的Python、Pandas和Matplotlib?我的版本是
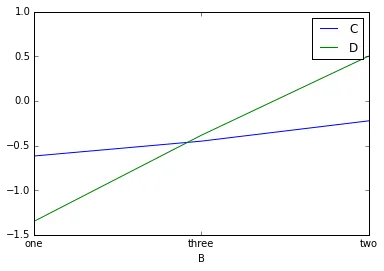
3.4.3, 0.17.1, 1.5.0。当我使用plt.plot(result)时,出现了错误ValueError: could not convert string to float: 'two' - Anton Protopopov
分别是:2.7.10,0.16.2,1.4.3(Anaconda 发行版)。对于我来说,这行代码绝对不会引发任何异常。无论如何,它也没有给我想要的图形 :) - Aristide
1个回答

1
获取图表的引用,然后使用标准的matplotlib命令进行操作。
p = plt.subplot(111)
p.plot(result)
p.legend(['C', 'D'])
plt.xticks(list(range(len(result))), result.index)
plt.xlabel(result.index.name)

enter image description here

当您有多个图表时,带有引用的版本非常有用:

p = plt.subplot(111)
p.plot(result)
p.legend(['C', 'D'])
p.set_xticks(list(range(len(result))))
p.set_xticklabels(result.index)
p.set_xlabel(result.index.name)

是的,我认为这与以下代码等效(不使用subplot):plt.plot(result); plt.legend(['C', 'D']); plt.show()。但是您知道如何恢复横坐标标签吗? - Aristide
添加了一个带标签的版本。 - Mike Müller
@MikeMüller 但是在pandas中,您的X轴标签将有两个级别,而在您的情况下只有一个。 - Anton Protopopov
好的。现在有第二级标签。 - Mike Müller
非常感谢,这正是我想要的结果。subplot 这个东西对于我这个新手来说仍然看起来很奇怪,但我猜这就是熊猫的方式! - Aristide
@Aristide 好的,如果你在一个画布或图形上绘制多个图形,则只需要使用子图。因此,在这种情况下,您不需要它,但人们出于习惯仍然坚持使用它。 - NoName

网页内容由stack overflow 提供, 点击上面的
可以查看英文原文,
原文链接