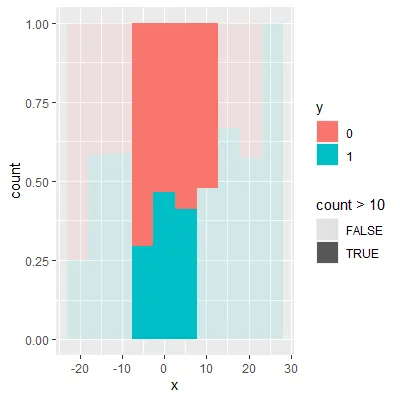
我正在尝试制作一个缩放的直方图,以这样的方式,即每个“列”(bin?)的透明度取决于给定x范围内观察值的数量。以下是我的代码:
set.seed(1)
test = data.frame(x = rnorm(200, mean = 0, sd = 10),
                  y = as.factor(sample(c(0,1), replace=TRUE, size=100)))
threshold = 20
ggplot(test,
       aes(x = x))+
  geom_histogram(aes(fill = y, alpha = stat(count) > threshold),
                 position = "fill", bins = 10)
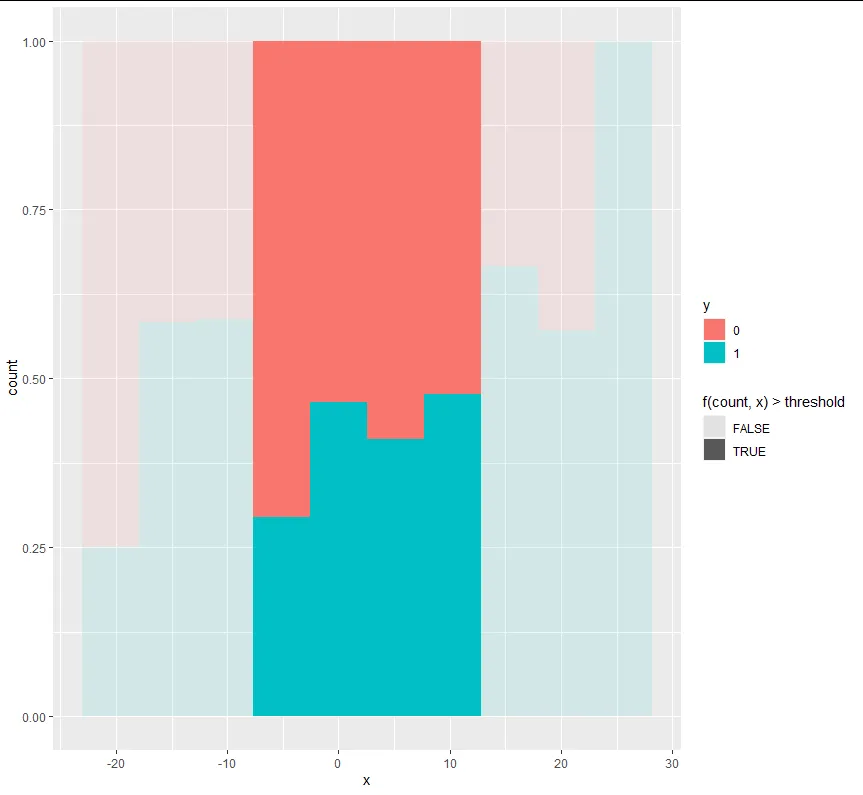
基本上我想制作的图表应该看起来像这样:
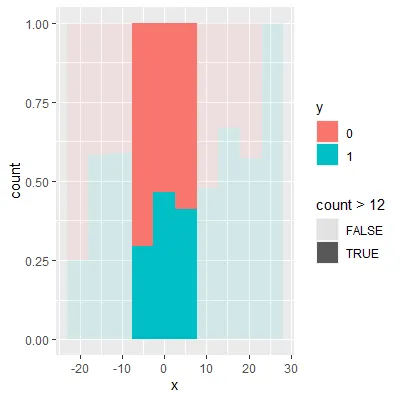
然而我的代码生成的图表中透明度基于分组后的计数进行应用,导致出现悬挂列,如下所示:
例如在这个例子中,为了模拟一个“正确”的图表,我只是调整了阈值,但我需要 alpha 考虑给定“列”(bin)中两个组的计数总和。
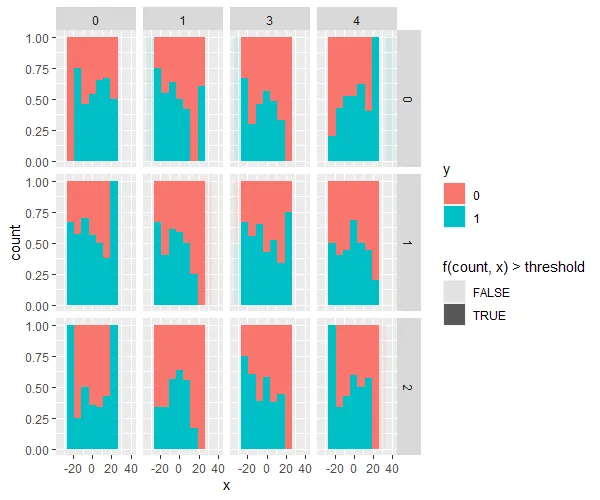
更新: 我还希望它能够与分面图一起使用,这样每个分面中的突出显示区域都独立于其他分面。@Stefan 提出的方法对于单个图表非常完美,但在分面图中会在所有分面中突出显示相同的区域。
library(ggplot2)

set.seed(1)
test = data.frame(x = rnorm(1000, mean = 0, sd = 10),
                  y = as.factor(sample(c(0,1), replace=TRUE, size=1000)),
                  n = as.factor(sample(c(0,1,2), replace=TRUE, size=1000)),
                  m = as.factor(sample(c(0,1,3,4), replace=TRUE, size=1000)))
f = function(..count.., ..x..) tapply(..count.., factor(..x..), sum)[factor(..x..)]
threshold = 10
ggplot(test,
       aes(x = x))+
  geom_histogram(aes(fill = y, alpha = f(..count.., ..x..) > threshold),
                 position = "fill", bins = 10)+
  facet_grid(rows = vars(n),
             cols = vars(m))