我想在直方图上覆盖一个直方图边框,但它们的位置不正确。
library(tidyverse)
data("iris")

iris %>%
  ggplot(
    aes(Sepal.Length)
  ) +
  geom_histogram(
    alpha = .5
  ) +
  stat_bin(geom="step") +
  facet_wrap(
    ~Species, ncol = 1
  )
返回值
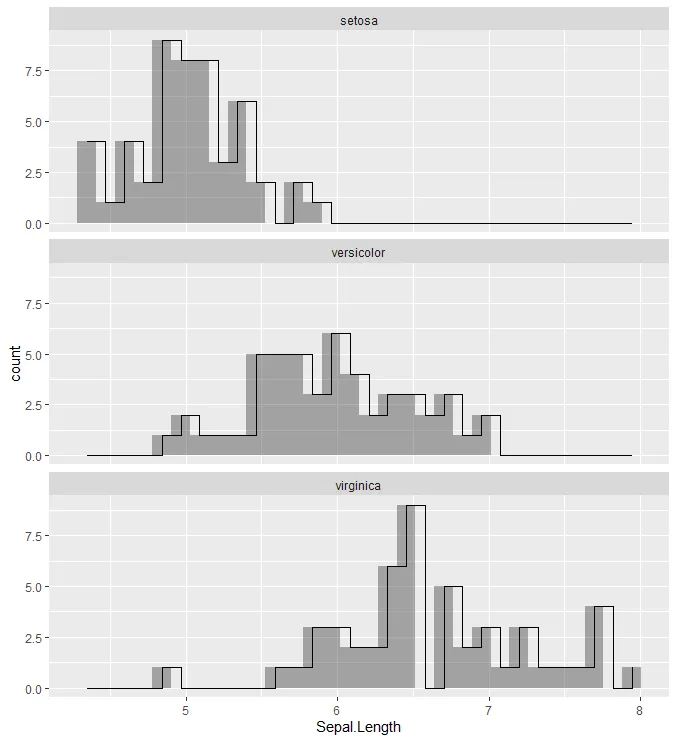
如何使边框与直方图对齐?
geom_histogram(alpha = 0.5, color = "blue"),那么这是否符合您的要求(我只添加了color = "blue")。 - stevebstat_bin("step"),这将为你提供直方图框周围的边框,而不需要尝试使用步进函数。我需要澄清一下,你是想在框上加一个边框还是移动stat_bin? - steveb