我目前有一些数据,基本上是一个因子和一个日期。这是一个简单的思路。
date <- c(1901,1901,1901,1902,1902,1902,1901,1903,1902,1904,1902,1903,1903,1904,1905,       1901,1903,1902,1904,1902,1902,1903,1904,1902,1902,1901,1903,1903,1904,1905, 1905,1906,1907,1908,1901,1908,1907,1905,1906,1902,1903,1903,1903,1904,1905,1901,1901,1901,1902,1902,1902,1901,1903,1902,1904,1902,1903,1903,1904,1905,
1901,1903,1902,1904,1902,1902,1903,1904,1902,1902,1901,1903,1903,1904,1905,
1905,1906,1907,1908,1901,1908,1907,1905,1906,1902,1903,1903,1903,1904,1905,
1905,1906,1907,1908,1901,1908,1907,1920,1920,1920,1921,1921,1921,1921,1921)

genre <- sample(c("fiction","nonfiction"),105,replace=TRUE)
data <- as.data.frame(cbind(date,genre))
# I know this is not an ideal way to coerce to a numeric
data$date <- as.numeric(as.character(data$date))
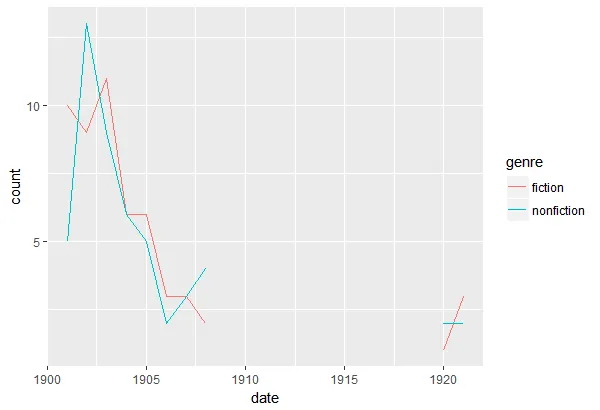
目前为止,一切都很好。如果你绘制它,你会注意到数据中存在一个大的间隔,而这条线遮盖了它。以下图表将加以说明。
library(ggplot2)
ggplot(data,aes(x=date,color=genre)) + geom_line(stat='count')
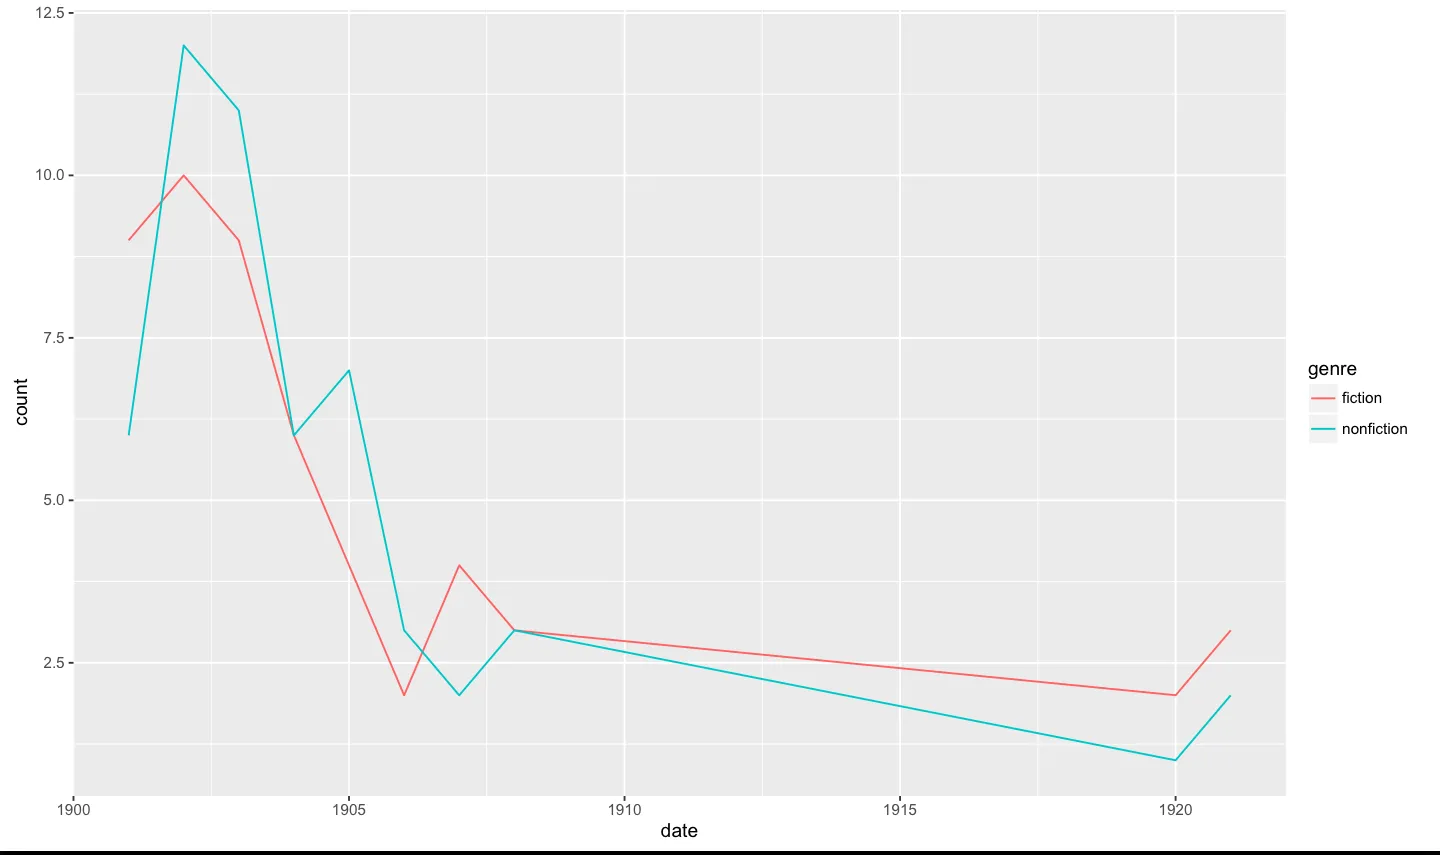
我看过这篇文章,它建议添加一个分组,这个我可以做到。
data$group <- ifelse(data$date < 1910,1,2)
ggplot(data,aes(x=date,color=genre,group=group)) + geom_line(stat='count')
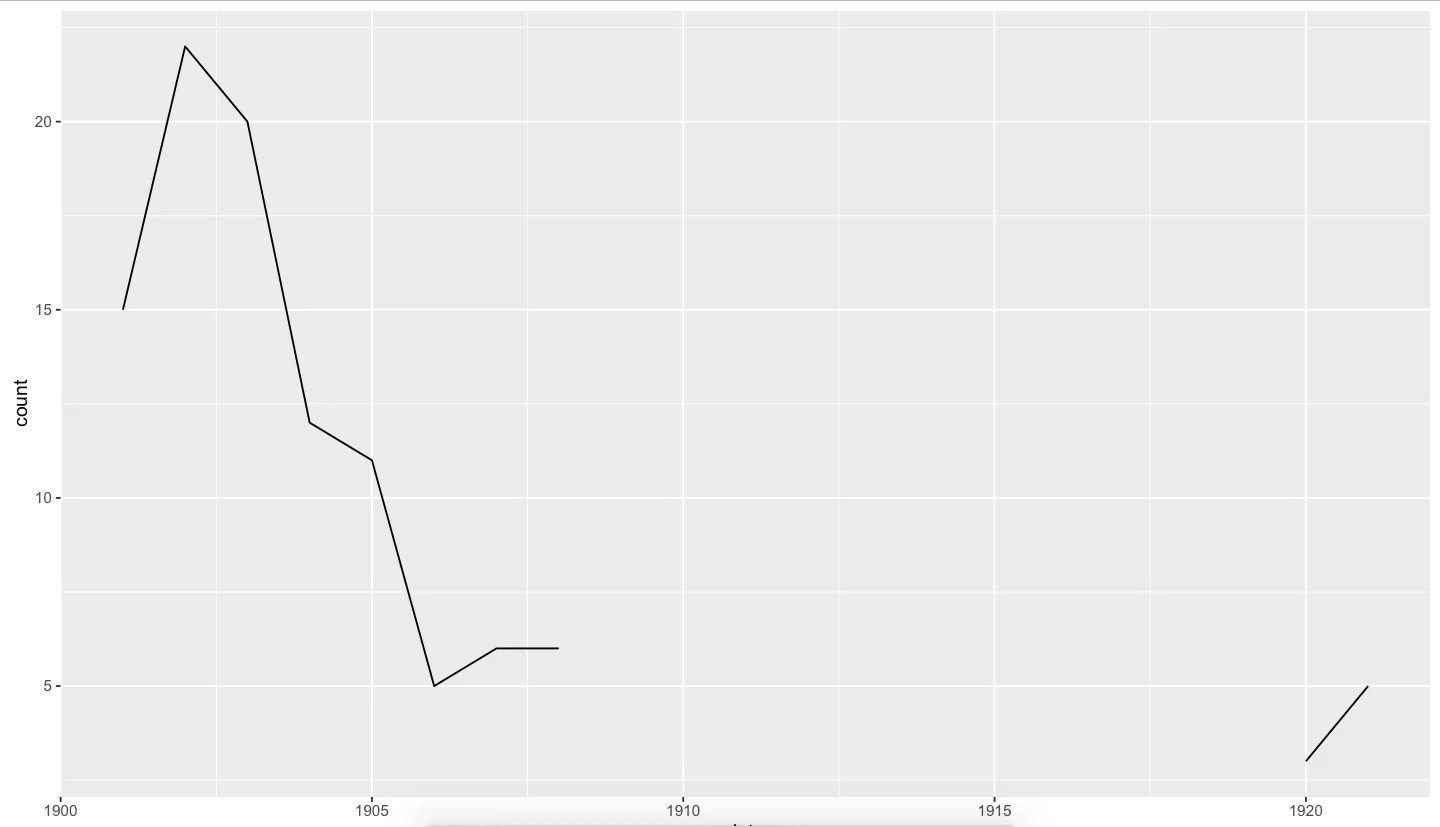
因此,似乎没有办法在使用stat='count'的情况下保留我想要的输出的颜色美学并指定group。例如,这个图很好地显示了数据中的间隙,但失去了基于genre因素的颜色/区分:
ggplot(data,aes(x=date,color=genre,group=group)) + geom_line(stat='count')
那么,这是不可能的吗?我有什么遗漏吗?有更好的方法来实现这个目标吗,还是我需要对我的日期进行summarize或其他变换,以便在绘图阶段不依赖于stat='count'?