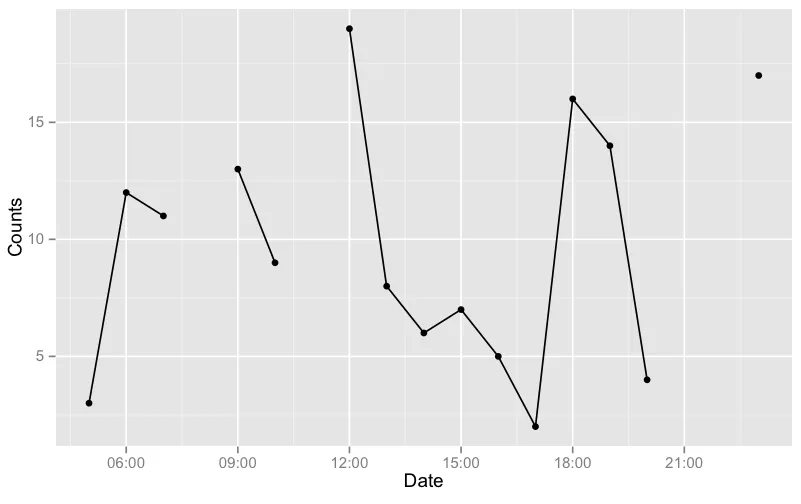
我使用R来绘制一些数据。
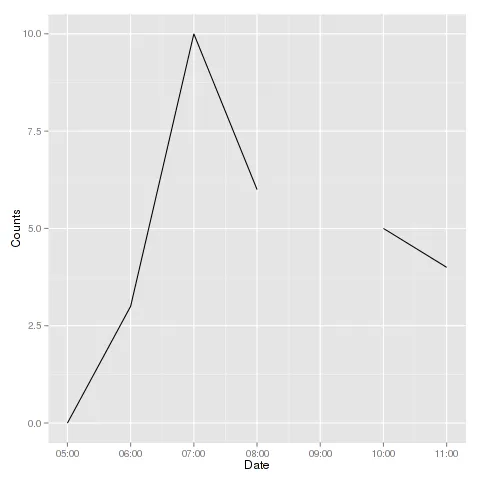
Date <- c("07/12/2012 05:00:00", "07/12/2012 06:00:00", "07/12/2012 07:00:00",
      "07/12/2012 08:00:00","07/12/2012 10:00:00","07/12/2012 11:00:00")
Date <- strptime(Date, "%d/%m/%Y %H:%M")
Counts <- c("0","3","10","6","5","4")
Counts <- as.numeric(Counts)
df1 <- data.frame(Date,Counts,stringsAsFactors = FALSE)
library(ggplot2)
g = ggplot(df1, aes(x=Date, y=Counts)) + geom_line(aes(group = 1))
g
df <- structure(list(Date = c("11/12/2012", "11/12/2012", "11/12/2012",
                     "11/12/2012", "11/12/2012", "11/12/2012", "11/12/2012",
                     "11/12/2012", "11/12/2012", "11/12/2012", "11/12/2012"),
                     Time = c("20:16:00", "20:16:10", "20:16:20", "20:16:30",
                     "20:16:40", "20:16:50", "20:43:30", "20:43:40",
                     "20:43:50", "20:44:00", "20:44:10"),
                     Axis1 = c(181L, 14L, 65L, 79L, 137L, 104L, 7L, 0L, 0L,
                     14L, 0L),
                     Steps = c(13L, 1L, 6L, 3L, 8L, 4L, 1L, 0L, 0L, 0L, 0L)),
                .Names = c("Date", "Time", "Axis1", "Steps"),
                row.names = c(57337L, 57338L, 57339L, 57340L, 57341L, 57342L,
                57502L, 57503L, 57504L, 57505L, 57506L), class = "data.frame")
我认为我理解了代码添加“组”列到原始数据帧时试图做什么,但我的问题是如何让R知道数据现在是以10秒时间间隔呈现的?当我应用第一行代码来确定数字是否连续或是否存在间隔(例如idx < - c(1,diff(df $ Time))),我会得到以下错误:
Error in r[i1] - r[-length(r):-(length(r) - lag + 1L)] :
  non-numeric argument to binary operator
在我的Time变量后,我是否需要添加as.POSIXct来确保它正确识别时间?