情况:
我有一个ggplot图表,想要添加一些文本注释。文本注释应该显示为两行(便于阅读和节省空间),每行包含一些TeX公式:
library(tidyverse)
library(latex2exp)
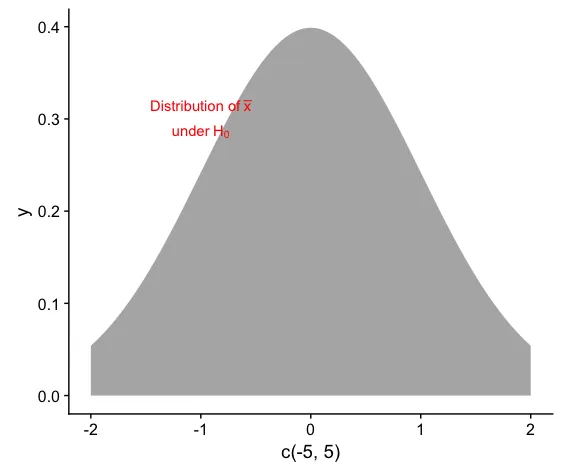
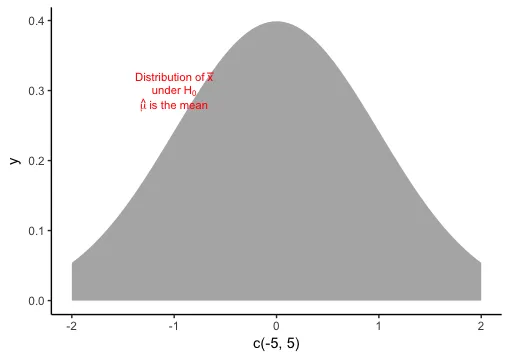
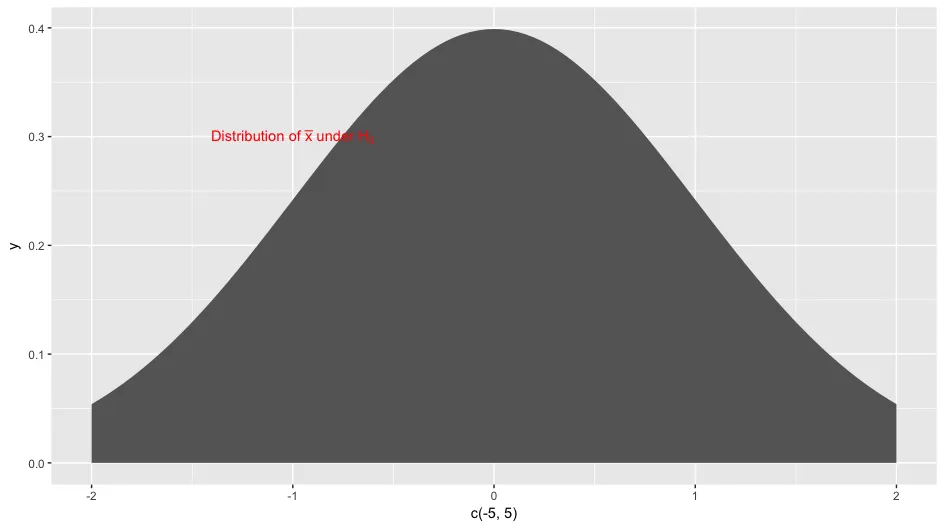
ggplot(NULL, aes(c(-5,5))) +
geom_area(stat = "function", fun = dnorm, fill = "grey40", xlim = c(-2, 2)) +
annotate(geom = "text", label = TeX(paste("Distribution of $\\bar{x}$","\n","under $H_0$")),
x = -1, y = 0.3,
color = "red")
问题:
换行符未显示,文本没有分为两行。
未成功尝试的方法:
我已经尝试使用paste(TeX(...))和parse = T,但均未成功。
我还尝试了这个label = expression(paste("distribution of ", bar(x), "\n", "under H0")),并在这里查阅过,但仍然没有成功。
问题:
如何将注释(红色文字)拆分为两行?